1 / 1

Normalized gene expression levels

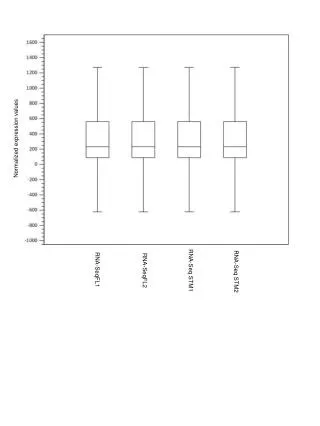
Normalized gene expression levels. shoot. Supplemental Figure 5. Expression patterns of Glyma03g31980 ( CND ) and Glyma17g07330 in 10 soybean tissues.

ohio
Download Presentation

Normalized gene expression levels

An Image/Link below is provided (as is) to download presentation Download Policy: Content on the Website is provided to you AS IS for your information and personal use and may not be sold / licensed / shared on other websites without getting consent from its author. Content is provided to you AS IS for your information and personal use only. Download presentation by click this link. While downloading, if for some reason you are not able to download a presentation, the publisher may have deleted the file from their server. During download, if you can't get a presentation, the file might be deleted by the publisher.

E N D

Presentation Transcript


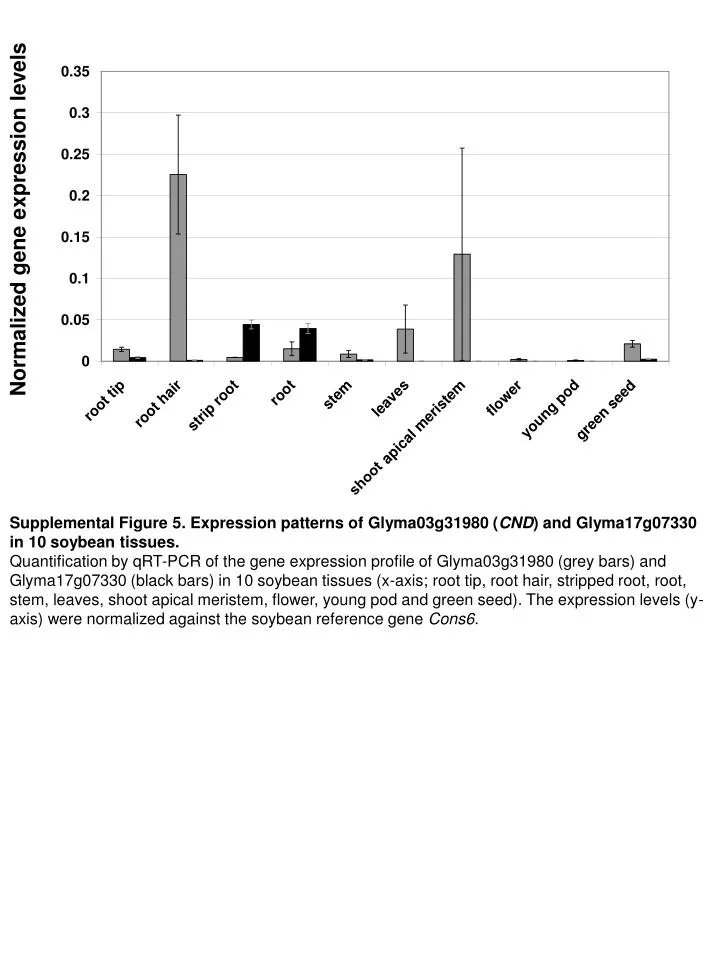
  1. Normalized gene expression levels shoot Supplemental Figure 5. Expression patterns of Glyma03g31980 (CND) and Glyma17g07330 in 10 soybean tissues. Quantification by qRT-PCR of the gene expression profile of Glyma03g31980 (grey bars) and Glyma17g07330 (black bars) in 10 soybean tissues (x-axis; root tip, root hair, stripped root, root, stem, leaves, shoot apical meristem, flower, young pod and green seed). The expression levels (y-axis) were normalized against the soybean reference gene Cons6.

More Related