Download
1 / 45
451 likes | 530 Views
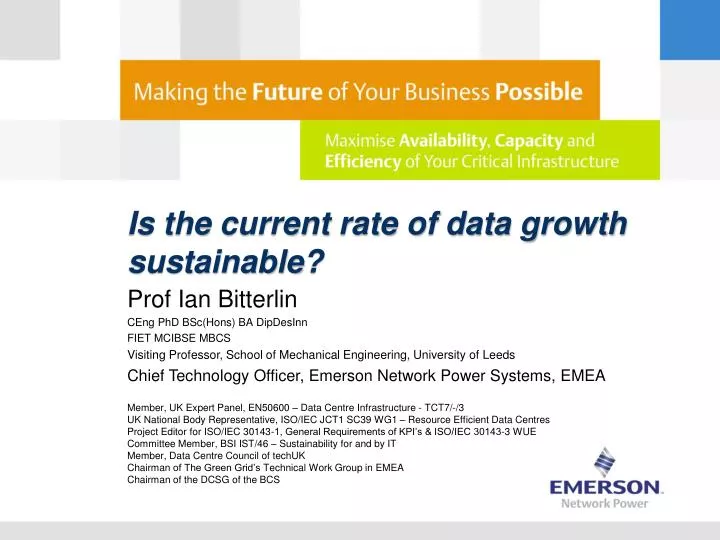
Is the current rate of data growth sustainable?. Prof Ian Bitterlin CEng PhD BSc (Hons) BA DipDesInn FIET MCIBSE MBCS Visiting Professor, School of Mechanical Engineering, University of Leeds Chief Technology Officer, Emerson Network Power Systems, EMEA.

E N D
Is the current rate of data growth sustainable? • Prof Ian Bitterlin • CEng PhD BSc(Hons) BA DipDesInn • FIET MCIBSE MBCS • Visiting Professor, School of Mechanical Engineering, University of Leeds • Chief Technology Officer, Emerson Network Power Systems, EMEA Member, UK Expert Panel, EN50600 – Data Centre Infrastructure - TCT7/-/3 UK National Body Representative, ISO/IEC JCT1 SC39 WG1 – Resource Efficient Data Centres Project Editor for ISO/IEC 30143-1, General Requirements of KPI’s & ISO/IEC 30143-3 WUE Committee Member, BSI IST/46 – Sustainability for and by IT Member, Data Centre Council of techUK Chairmanof The Green Grid’s Technical Work Group in EMEA Chairman of the DCSG of the BCS
Agenda • What is driving growth? Is growth a problem? • What could moderate growth? • Where could it all end? • What could be improved now? • Standards, metrics & best practices? • The future?
14 years of exponential data growth 690 TB/month in July 2001 578,000 TB/month in January 2014 Growth = 840x (60%CAGR)
The Law of Accelerating Returns, Kurzweil Information generation 2009 = 50GB/s 2020 = 500GB/µs 10,000,000x increase The Singularity is Near Raymond Kurzweil, 2005, Viking Ray Kurzweil has been described as “the restless genius” by the Wall Street Journal, and “the ultimate thinking machine” by Forbes magazine, ranking him #8 among entrepreneurs in the United States and calling him the “rightful heir to Thomas Edison”. PBS included Ray as one of 16 “revolutionaries who made America,” along with other inventors of the past two centuries.
Fast broadband for all? The EU has a digital agenda that involves 20MBs super-fast broadband for all citizens at an affordable price, if not free to those who are less able to pay… Faster access will, according to Jevons Paradox, generate a power demand increase but no government has yet appeared to understand the direct linkage mechanism between data-generation and power demand… Faster access used for education, security & medical services may be key to many poorer nations development 7 Billion global population, c2 Billion internet connections? ‘Internet access will become a privilege, not a right’ Vint Cerf, 2011 Inventor of the IP address and often regarded as one of the ‘Fathers of the Internet’ Now VP and Chief Internet Evangelist, Google – working on inter-Galactic IP addresses
Maslow's Hierarchy of Needs Sex Excretion Wi-Fi, YouTube & Facebook
Jevons Paradox ‘It is a confusion of ideas to suppose that the economical use of fuel is equivalent to diminished consumption. The very contrary is the truth’ William Stanley Jevons, 1865 The Coal Question, Published 1865, London, Macmillan & Co Newcomen’ s engine was c2% thermally efficient and coal supplies in the UK were highly strained Watt’s engine replaced it with c5% efficiency - but the result was rapid increase in coal consumption Can the same be said of data generation?
Data generation growth At Photonics West 2009 in San Jose, Cisco correctly predicted for 2012 that ‘20 US homes with FTTH will generate more traffic than the entire internet backbone carried in 1995’ Japanese average home with FTTH - download rate is >500MB per day, dominated by HD-Video One Sky movie download = 1.3GB 4K UHD-TV will just increase traffic and power consumption More video content is uploaded to YouTube every month than a TV station can broadcast in >300 years 24/7/365 Phones with 4G are huge data-generators. Even with 3G in 2011 Vodafone reported a 79% data-growth in one year – was that all social networking?
Infrastructure takes energy… Based on Jay Walker’s recent TED talk, 0.01kWh of energy is consumed on average in carrying 1MB over the Internet. TIME magazine reported that it takes 0.0002kWh to stream 1 minute of video from the YouTube data centre… The average home device energy consumption is around 0.001kWh for 1 minute of video streaming For 1.7B downloads of this 17MB file streaming for 4.13 mins gives the overall energy for this one viral pop video in just one year…
298GWh in just one year... • 35MW of 24/7/365 power generation • Cambridge? • 100 million Litres of fuel oil • 250,000 Tons CO2 • 80,000 UK car years • Viral videos appear every day, numerous examples at >20Bn rate • e.g. Volvo (JC van Damme) 298GWh = more than the annual electricity consumption of the 9 million population of the Republic of Burundi(East Africa) who used 273GWh in 2008
ICT power – unsustainable? • ICT in total is generally regarded as consuming 6-9% of the grid and data centres 1/3rd of that, so… • Data centres consume 2-3% of our grid capacity and that is currently growing at c20%CAGR
What is Data Centre Efficiency? • Efficiency = output ÷ input • Power (kW) or Energy (kWh) • What is the output of a data centre? • Digital services and 100% heat • Better to use the terminology of Effectiveness • PUE, WUE, CUE... • Productivity metrics are the hardest to define • ITEE+ITEU for servers, storage & I/O • True sustainability is more complicated...
3-steps to classical sustainability • Reduce consumption • What is the social & economic ‘value’ of the data processed? • Virtualization, high utilisation, frequent ICT refresh • Improve: 2014 average server runs at 10% utilisation on 40% power • Restrict access for certain applications, de-duplicate data • Improve efficiency (effectiveness) • Moore’s Law plus a paradigm shift in network photonics? • PUE, WUE, REF, CUE, RWH, ITEE & ITEU + .... • Power from renewable energy sources • Building a ‘legacy’ data-centre next to a hydro-electric scheme is NOT a sustainable design, it could be a waste of renewable energy on an ineffective data centre if the first two steps are not taken
Step 1 – Reduce consumption • EU (DG Connect) is starting down the road of regulating data centre power • Fixated by renewables for ICT • EU is ‘discussing’ (but will probably reject as political suicide) the throttling-back of broadband for certain applications – regulation, taxation? • Remove HD-cameras from mobile-phones? • Natural limits on network capacity will place ‘Jevons’ type barriers to ‘unlimited’ bundles
Step 2 – Improve effectiveness • Gordon Moore, founder of Intel, wrote his Law >35 years ago when he predicted the doubling of the number of transistors on a microprocessor every two years • Has held true ever since • Directly applies to • Doubling compute capacity • Halving the Watts/FLOP • Halving kWh per unit of compute load etc • Law ‘updated’ by Intel to 18 months for clock-rate • Kurzweil suggests that the doubling is ‘now’ every 14 months • Encourages ever-shorter hardware refresh rates • Facebook 9-12 months – slows down data centre growth • Keeping IT hardware >3 years is now energy profligate
Five ‘Moore’ years? Is 3D graphene the fifth paradigm?
14 years of performance improvement Best-in-Class 100% in 2001 0.08% in 2014 Moore's Law Clock-rate, 1-5GHz PUE, 2.5 to 1.3 Virtualization, 0-40% Utilization, 5-40% 1,250x 70%CAGR 40%CAGR
Average age of installed server base? • Best in class, today c700x 2001 • Best practice, today c1250x 2001 • Best practice, 4 year old base c100x 2001 2001 5MW site 2MW IT load 2000 cabinets C3000m2 2014 Best Practice/4y 50kW site 30kW IT load 5 cabinets C16m2 2014 Best Practice, today 4kW site 2.4kW IT load <1 cabinet C3.2m2
Step 3 – Renewable power? • There is no logical reason why ICT should be powered by renewable power ahead of other (more?) noble applications like research, medicine, education or social services… • Solar-PV power can only contribute <1.5% to a data centres power demand, everything else has to be imported • In ISO/IEC 30143 there will be an REF and a CUE metric
So now it’s the turn of the ‘One’! Typical 2014 servers consume 40% (from as low as 25% to as much as 80%) of their peak power when doing zero ICT ‘work’ Average microprocessor utilisation across the globe is <10%, whilst the best virtualisation takes it to c40% for relatively rare homogeneous loads & only >90% for HPC If the IT hardware had a linear power demand profile versus IT load we would only be using 20% of the grid power of today PUE of <1.2 is a law of diminishing returns and increasing risk The key to energy effectiveness is utilisation Stranded capacity and under-utilisation reverses the gap between demand growth and ‘best-in-class’ ICT performance. We need to: Optimise compute, storage & I/O provision (frangible infrastructure) Virtualize, heavily and repeatedly Turn off unneeded capacity
Spec_Power: Server OEMs input the data Utility servers In this small extract from the web-site, HP ProLiant models average 41% idle power and vary from 24% to 79% Experts predict that 23% is the minimum for Silicon http://www.spec.org/power_ssj2008/
The real ‘efficiency’ battleground… Where we are Where we should be heading Average utilisation must increase The IT load will become highly dynamic and the PUE may get ‘worse’, although the overall energy consumption will reduce
ISO/IEC JTC1 SC39‘Sustainability for and by ICT’ • Very active China, Korea & Japan with USA (chair), UK, Germany, France & Canada. Late involvement by NL and Finland • Follows closely The Green Grid work, less close with ETSI, EU-CoC or ITU – but ISO is a ‘National Body’ org • WG1 – KPIs; 30134-1 out for CD • PUE: 30134-2 out for CD • WUE, CUE, REF, RWH – at least two for CD in 2014 • ITEE & ITEU under considerable pressure • WG2 – Taxonomy, Maturity Model, Best Practice
EU CoC Best Practice Cooling efficiency Local humidity but consider water-usage Rigorous air-management in the room High server inlet temperature (but avoiding fan ramp-up) Minimise humidification and de-hum Free-cooling coils for when the external ambient is cool Confusion between free-cooling and fresh-air cooling If possible avoid compressor operation altogether Power efficiency Avoid high levels of redundancy and low partial loads in general Design redundancy system to always run at >70% load Adopt line-interactive or eco-mode operation, efficiency is >98% at 50% load Apply high efficiency lighting Best practice gets to a PUE of 1.11-1.15 But does the risk (real or perceived) increase?
PUE = 1.7 (EU CoC Participant average) 5 kW 15 kW 250 kW 470 kW 35 kW 13 kW 2 kW Total 800 kW Ventilation – Fresh Air Lighting & small power 1MVA Cooling fans, pumps & compressors IT terminal load Distribution & conversion losses Security, NOC, BMS, outdoor lighting Communications
ASHRAE - widening the thermal envelope The critical change has been to concentrate on server inlet temperatures, maximising the return-air temperature Rigorous air-containment is ‘best practice’ Choice of Class determines minimum pPUE Will ASHRAE go further and expand the ‘Recommend’, not just the ‘Allowable’? Probably not… why?
Read and understand ALL of ASHRAE TC9.9 • Who ‘are’ TC9.9? • Use 2011, not 2008, and understand RH & dew-point • Why is the ‘Recommended’ range the same for all the Classes of hardware? • Look beyond Table 4 – there are 45 pages of reasons why you would, or would not, want to increase temperature &/or humidity etc • Understand ‘2011 Gaseous and Particulate Contamination Guidelines For Data Centers’ – it points the way to Indirect Economization
Is the ‘cold climate’ hand played out? • Yes for London, Frankfurt, Amsterdam, Paris and Madrid without any excursion from ‘Recommended’ same pPUE • Yes for all of southern Europe if you allow brief excursions into ‘Allowable’ • No longer an advantage going North, other than cheap energy and clean air
Is chilled water a sunset industry? No… 1000x? pPUE 1.08 Chilled? 20/26°C
Forces for change • Cost of energy! Cost drives behaviour… • ASHRAE TC9.9 has slowly been widening the ‘recommended’ and, much faster, the ‘allowable’ thermal windows • Temperature to 45°C, Humidity <90%RH, non-condensing • Thermal management, not refrigeration, in the future • Strict air-management is key, maximising exhaust air temperature and free-cooling hours • The Green Grid DCMM – Data Center Maturity Model • Eco-mode UPS and no refrigeration, even in back-up • EU CoC Best Practice Guide • Eco-mode UPS and 100% free-cooling without refrigeration • ISO/IEC, ETSI & ITU are pushing energy efficiency of data centres to the top of the agenda
Water consumption reduces PUE • Away from the tropics, consuming water on site enables the utilisation of the wet-bulb temperature rather than the dry-bulb temperature (usually 10°K lower in Europe) • Evaporative pads on air-cooled chillers • Adiabatic sprays in thermal management systems • Indirect economisation removes all risks of corrosion caused by combinations of temperature, humidity and chemical contamination • Overall water consumption (end-to-end fuel extraction, power generation and consumption) is lower • WUE will be an important future metric but… • Storage? Grey or potable? Rainwater harvesting?
Reuse of waste heat will be important • The RWH metric is coming from ISO/IEC • Importance will be on the efficiency of the transfer and the actual consumption of the energy • Difficult to find constant (high) heat loads 8760h • Data centres are very power dense • 50x a standard office environment • Low energy cooling produces low grade heat • Mega-centres are distant from loads • Maybe small water cooled rooms are part of the future?
Modularity counters partial load • Partial load is an endemic problem in data centres • 600MW of Trinergy UPS sold over 3 years, module load <30% • Virtualisation and other best-practices usually makes the PUE worse and excessive redundancy doesn't help • Partial load is the enemy of high efficiency • Modularity in plant design is the only way to build capacity but manage redundancy and maximise individual module load
Partial load efficiency is key... N+1 white
What is your appetite for risk? • This is the first question that you should ask a data-centre client • Thermal envelope for hardware • ASHRAE Class 1,2, 3 or 4? • Recommended, or Allowable for ‘X’ hours per year? • Contamination and corrosion • Air quality? Direct or Indirect Economisation? • Power quality of the grid, eco-mode enablement? • Maintainability • Concurrent maintenance and fault tolerance? • High reliability costs a little more CapEx & OpEx • Risk determines design PUE
Types of data centres? • Micro • Will probably decline in favour of collocation • Enterprise • Will probably shrink slightly, plus some parts going to collocation • Government, Military and Security • Unlikely to change beyond striving for lower energy • Telecom • Total blur with converging networks, largest traffic growth from mobile applications, will increasingly offer collocation • Collocation • Will be the fastest growing sector • Will slowly change basis of SLA’s to energy efficiency • Hyperscale • Unrepresentative of the industry with single app and ultra-low PUE • All sectors are likely to grow but in different rates/locations
Next generation servers • Frangible infrastructure • Front access only, power and connectivity • Optimised for 27⁰C inlet temperature • Fan-power c5% of server power, e.g. 15W in 300W • 20⁰K delta-T, therefore hot-aisle is 47⁰C • Capable of 45⁰C inlet temperature • Fan-power rises as a cube law to c200W so server power rises to 500W total • Hot-aisle 65⁰C (system return temperature) • H&S issue • No receptacles or PDUs, fibre restrictions, hence front access • Noise is ^5 law – H&S issue for large rooms
Is the future already here? • If you want to grasp it…yes • N+1 Indirect Adiabatic cooling pPUE = 1.03-1.12 • 2N advanced eco-mode modular UPS pPUE = 1.03 • Lights, NOC, security etc pPUE = 1.02 • PUE3 = 1.08–1.17 • Climate dependent (external humidity) • ASHRAE ‘Recommended’ envelope, no fresh-air in the room and humidity controlled to client requirements • Typical WUE = 0.12 L/kWh • External wet-bulb 23⁰C = max server inlet temperature of 30⁰C • <5ms zero-volts power fidelity, better than the 20ms limit of the 1997 CBEMA curve &10ms of the ‘2012 Typical’
But our industry is dominated... • By Paranoia, not engineering • Fear of service disruption & fear of the unknown leading to no appetite for risk taking • No data centre has ever been designed to save the user energy, availability is the driver • To provide digital services and meet the digital agenda of the operator/user • To generate revenue and to protect revenue (enable business continuity) • Very few early adopters, low appetite for innovation or risk • But the cost of energy or carbon based taxation will accelerate innovation and adoption
Can data centres be ‘sustainable’? Never in isolation! Data centres are the factories of the digital age They convert power into digital services – its impossible to calculate the ‘efficiency’ if there is no definition of ‘work done’ All the energy is converted into waste and, in almost every case, is dumped into the local environment Not ‘sustainable’, unless … Minimised consumption by best-in-class hardware and operations The application of the data centre is an enabler of a low-carbon process They have reduced their PUE to the minimum to meet the business case They source their energy from low-carbon sources They re-use a high proportion of the waste heat… Is a ‘parallel computing’ model ‘efficient’? If you build two low PUE facilities & push redundancy and availability into the hardware-software layer then your peak overall power consumption could be >2
Standards? Guides? Certifications? • There are no European standards ‘yet’ • EN 50600 Infrastructure is coming 2014-15 • ISO/IEC Metrics are coming 2014-16 • ASHRAE TC9.9 Thermal Guidelines are not a ‘standard’ but nothing else is published globally and is, by default, a ‘standard’ • TIA-942 is an ANSI Standard – now a schism with TUI • Plenty of ‘Best Practice’ & ‘Design’ guides • The Uptime Institute, now withdrawn in favour of ‘operational sustainability’ • BICSI, quite North American centric • EU CoC – more Participants needed • The Green Grid DCMM • Certifications incl UTI, TIA, CEEDA, DCA
Data Centres are at the heart of the internet and enable the digital economy, including the concepts of smart-cities and smart-grids Data-centres will expand as our demands, in both social and business contexts, for digital content and services grow Facilities will become storage dominant and footprint will increase… Loads will become more load:power linear and, as a result, more dynamic Thermal management will become increasingly adopted and PUE’s will fall to c1.2 Only larger, highly virtualised and heavily loaded facilities will enable low-cost digital services as the cost of power escalates (the hardest for RWH to be applied) Despite industry best efforts power consumption will rise, not fall Best forecasts show a growth rate at c20% CAGR for the foreseeable future – often in connected locations where energy is cheap and taxes are low… Utilisation is the single largest factor in moderating power growth Data growth continues to outstrip Moore’s Law and a paradigm shift in network photonics and devices will be required but, even then, a change in usage behaviour will probably be required … Predictions?
Predicting the future of IT is hard... Top500 Nov 2013, China Milky Way-2 33.86 PetaFLOPS (55 peak) 20,000x the speed of 1997 17MW Source: www.top500.org 2006 Sony Playstation3 1.8 teraflops 0.08m² 190W 1997 – the world’s fastest super-computer SANDIA National Laboratories ‘ASCI RED’ 1.8 teraflops 150m² raised floor 800kW