Download
1 / 19
190 likes | 295 Views
Beam Loss Instrumentation and Profile Measurement R&D within the QUASAR Group. C.P. Welsch. Medical Physics Beam Extraction APCT. SC Linacs HOM Studies Material Studies. USR @ FLAIR Ring design Instrumentation Experiments. CTF3 / CLIC Halo studies BLM (Fibres).

E N D
Beam Loss Instrumentationand Profile Measurement R&Dwithin the QUASAR Group C.P. Welsch
Medical Physics • Beam Extraction • APCT SC Linacs • HOM Studies • Material Studies USR @ FLAIR • Ring design • Instrumentation • Experiments CTF3 / CLIC • Halo studies • BLM (Fibres) Overview of Activities
Beam Halo Monitoring • Studies ongoing since 2004 • Fixed mask technique (T.L.) • CID camera • Flexible mask technique • Requires close interaction with beam dynamics experts (CI ↔ CERN) • Monitors characterized in lab 2008 and 2009, first tests with beam will be done at U Maryland.
CID Technology Source: Thermo Fisher Scientific
CID Camera Measurements • New model (XDR): Dynamic range of up to 107 in lab tests. • Laser beam used as reference • Long acquisition times (10s of min.) • High costs C.P. Welsch et al., Meas. Sci. Technol. 17 (2006) 2035c
Core Masking Technique: The Idea (1) Aquire profile (2) Define core (4) Re-Measure (3) Generate mask
Micro Mirror Array • 1024 x 768 pixels (XGA) • USB Interface • high-speed port 64-bit @ 120 MHz for data transfer • up to 9.600 full array mirror patterns / sec (7.6 Gbs) • 16 mm in size • +/- 10° of rotation • Switch of 15 ms physically, 2 ms optically
Results from Measurements • Dynamic range of up to 105.5 • Interference in centre • Now: Fully automized • Next step: Measurements with beam J. Egberts et al., DIPAC 2009
Gas Jet-based Monitor Principle: • Development of gas jet with highly flexible geometry (intensity and shape), • Measurements with high dynamic range by curtain, • (Generation of desired halo distribution) • Goal: Benchmarking and improvement of models. Beam Gas jet curtain
Numerical Investigations with GDT M. Putignano
Experimental Setup • Jet characterization by e- beam and laser self-mixing • Vacuum chambers presently build up • First tests 2nd half of 2009 • Tests at CTF3 could be an interesting option. M. Putignano
Beam loss monitoring Major complication: Two beams ! M. Wood, T. Lefevre 100 A, 2.4GeV A. Intermite
The Monitor • Exploitation of Cherenkov-radiation in optical fibres • Based on DESY work • 4x2 fibres around vacuum chamber • Short individual fibres for true 3D analysis • Goal: Detect on 10-4 level of nominal current • Steps: • Optimization of light capture in fibres • Lab tests of fibre coupling/splicing • Monte Carlo studies (@ CERN) • "cross-talk" between losses from both beams
Advantages • Fast time response • Transverse and longitudinal information • Insensitive against E and B fields • Radiation hard • Space requirement of monitor • Losses can be tuned continuously • Malfunctions of machine elements can be monitored
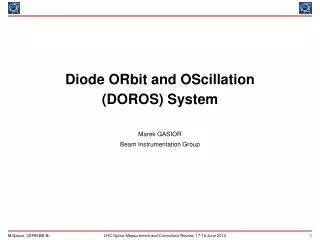
Optical Fiber Sensor based on SiPM composed of SPAD Array. Two arms: Reference fiber. Composite fiber. Working Principle • Features: • Optical fiber diameter: 1mm2 as the dimensions of SiPM active surface. • Numerical aperture of fibers between 0.22 and 0.63. (+ photonic bandgap fibres ?) • Pure silica (and PMMA ?) multimode step index fibers with n = 1.46. • SiPM recovery time ca. 4 ns. • SiPM quantum efficiency 15 % in the blue wavelength range
Study of Cerenkov effect in optical fibers (ongoing). C++ code for simulation of coupling efficiency of Cerenkov photons in multimode step index fibers with numerical aperture in the range between 0.22 and 0.63 (ongoing, see right). To be included until end of summer 2009: Splicing losses Cleaving angle of Optical Fibers Optical Fiber-SiPM Coupling losses Theory
Experiment • SiPM results on simulating bunches‘ sequence by a pulsed laser with λ= 450 nm; • Splicing tests for choosing suitable fibers: about 15 stages with losses between 0.45-0.20 dB; • Monitor splicing losses for high radiation levels; • Calibration of the sensor with the SiPMs: 400×400 or 289×289 SPADs for 1 mm2 active surface will be used; • We need (in collaboration): Accurate simulations of losses. • Work plan until end of 2010 presently being finalized.
A. Intermite S. Artikova J. Egberts M. Putignano Beam Loss and Halo Monitoring BLM Detector (Barbara, Thibaut,…) Beam Halo (Thibaut,…) Beam Dynamics, Losses (Mariusz, Daniel,…)
Carsten.Welsch@quasar-group.org Conclusion • Beam loss and profile monitoring ongoing activities; • Close collaboration between CERN, CI, RHUL,… one of the key ingredients.