Download
1 / 3
30 likes | 186 Views
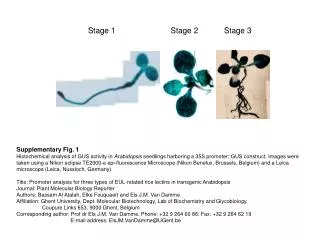
Supplementary Figures Fig. 1 Transcript levels of Tissue Factor, PAR-1 and PAR-2

E N D
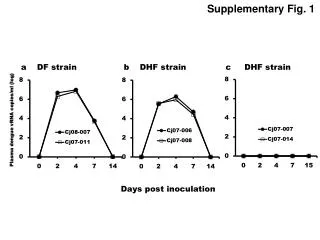
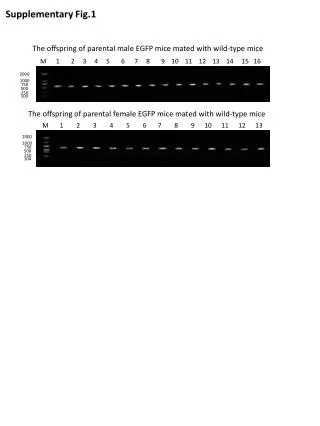
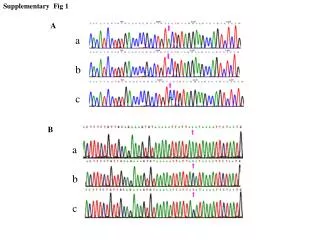
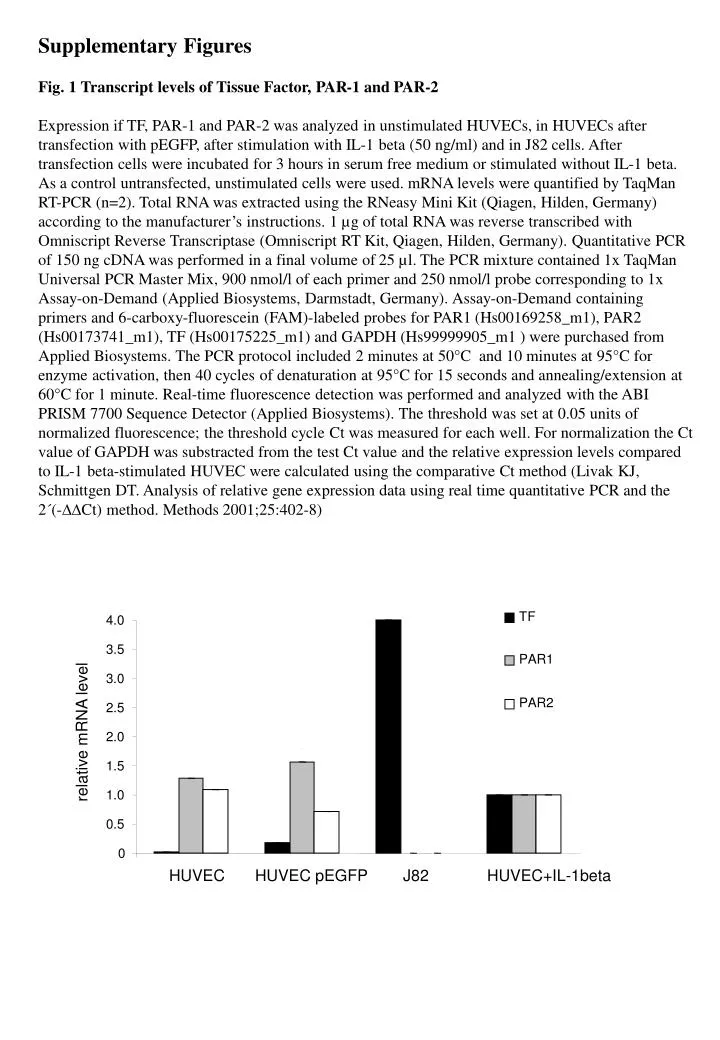
Supplementary Figures Fig. 1Transcript levels of Tissue Factor, PAR-1 and PAR-2 Expression if TF, PAR-1 and PAR-2 was analyzed in unstimulated HUVECs, in HUVECs after transfection with pEGFP, after stimulation with IL-1 beta (50 ng/ml) and in J82 cells. After transfection cells were incubated for 3 hours in serum free medium or stimulated without IL-1 beta. As a control untransfected, unstimulated cells were used. mRNA levels were quantified by TaqMan RT-PCR (n=2). Total RNA was extracted using the RNeasy Mini Kit (Qiagen, Hilden, Germany) according to the manufacturer’s instructions. 1 µg of total RNA was reverse transcribed with Omniscript Reverse Transcriptase (Omniscript RT Kit, Qiagen, Hilden, Germany). Quantitative PCR of 150 ng cDNA was performed in a final volume of 25 µl. The PCR mixture contained 1x TaqMan Universal PCR Master Mix, 900 nmol/l of each primer and 250 nmol/l probe corresponding to 1x Assay-on-Demand (Applied Biosystems, Darmstadt, Germany). Assay-on-Demand containing primers and 6-carboxy-fluorescein (FAM)-labeled probes for PAR1 (Hs00169258_m1), PAR2 (Hs00173741_m1), TF (Hs00175225_m1) and GAPDH (Hs99999905_m1 ) were purchased from Applied Biosystems. The PCR protocol included 2 minutes at 50°C and 10 minutes at 95°C for enzyme activation, then 40 cycles of denaturation at 95°C for 15 seconds and annealing/extension at 60°C for 1 minute. Real-time fluorescence detection was performed and analyzed with the ABI PRISM 7700 Sequence Detector (Applied Biosystems). The threshold was set at 0.05 units of normalized fluorescence; the threshold cycle Ct was measured for each well. For normalization the Ct value of GAPDH was substracted from the test Ct value and the relative expression levels compared to IL-1 beta-stimulated HUVEC were calculated using the comparative Ct method (Livak KJ, Schmittgen DT. Analysis of relative gene expression data using real time quantitative PCR and the 2´(-DDCt) method. Methods 2001;25:402-8) TF 4.0 3.5 PAR1 3.0 PAR2 2.5 relative mRNA level 2.0 1.5 1.0 0.5 0 HUVEC HUVEC pEGFP J82 HUVEC+IL-1beta
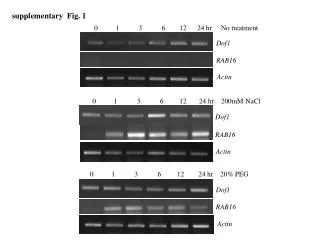
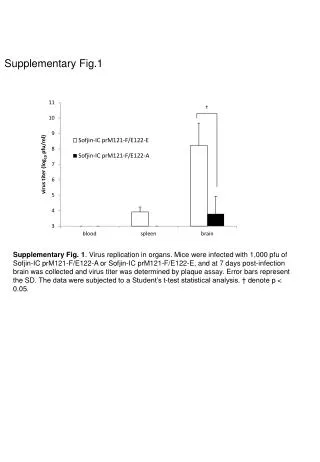
Fig. 2 Transfection does not significantly enhances TF surface expression and TF activity HUVEC were transfected with vector control (pEGFP) using Effectene as described in the methods section (n=5). Twenty-four hours after transfection cells were seeded at a concentration of 105 cells/ml on 96 and 6 well plate and incubated for another 24 hours. Then cells were harvested for TF surface expression and activity. TF surface expression was analyzed by flow cytometry (A). TF activity was measured using a FXa generation assay as described in supplementary Tab. 2 (B) A 18 16 14 12 10 Mean fl. 8 6 4 2 0 HUVEC HUVEC pEGFP B 0.25 0.20 0.15 FXa generation [mOD] 0.10 0.05 0 HUVEC HUVEC pEGFP
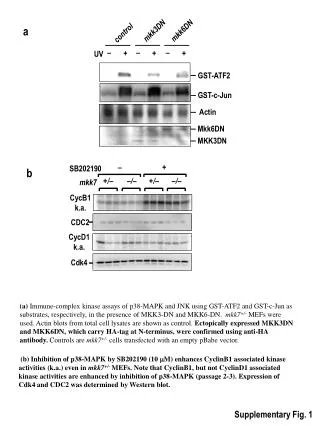
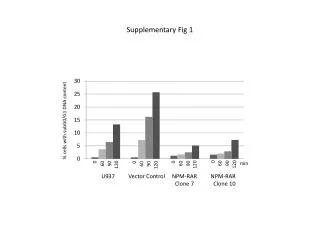
Fig. 3 Similar increases in TF surface expression and TF activity after transfection with pEGFP-TF and pEGFP-TFDcyt. HUVEC were transfected with the TF contructs pEGFP-TF and pEGFP-TFDcyt or vector control (pEGFP). Twenty-four hours after transfection cells were seeded at a concentration of 105 cells/ml on 96 and 6 well plate and incubated for another 24 hours. Then cells were harvested for TF surface expression and activity. TF surface expression was analyzed by flow cytometry (A). TF activity was measured using a FXa generation assay as described in supplementary Tab. 2 (B) A 80 70 60 50 Mean fl. 40 30 20 10 0 HUVEC pEGFP HUVEC pEGFP-TF HUVEC pEGFP-TFDcyt B 0.6 0.5 0.4 0.3 FXa generation [mOD] 0.2 0.1 0 HUVEC pEGFP HUVEC pEGFP-TF HUVEC pEGFP-TFDcyt