Download
1 / 31
310 likes | 444 Views
Uniform Motion, Speed and Graphs. Introduction to Physics. Physics!. What is it? Physics is the science of matter and energy and their interactions Why is it important to us? All around us! What will we be learning? Energy! And how it relates to movement, forms of energy,

E N D
Uniform Motion, Speed and Graphs Introduction to Physics
Physics! • What is it? • Physics is the science of matter and energy and their interactions • Why is it important to us? • All around us! • What will we be learning? • Energy! And how it relates to movement, forms of energy, thermodynamics
Topics for Today: • Physics Intro • Uniform Motion • Average Speed • Scalar vs Vector Quantities (intro)
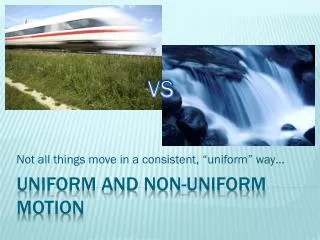
Some definitions • Motion: • Move away from a reference point • Reference point: where we make our observations in relation to • Uniform motion: • Object travelling at a constant rate of motion in a straight line • Is it possible to maintain uniform motion? • Ex. Why is it hard for a car travelling at 100 km/hr to maintain uniform motion?
Uniform Motion • Is it possible to maintain uniform motion? • Ex. Why is it hard for a car travelling at 100 km/hr to maintain uniform motion? • Objects can’t maintain the motion due to external factors, like friction and wind resistance when driving.
Average Speed • Average speed is uniform motion that involves traveling a certain distance in a specific time • Direction of movement is not involved. It is like looking at the speedometer of your car to see how fast you are going. It doesn’t tell you what direction you are going. • There are two ways to calculate average speed • Using a formula (today’s topic) • Graphing data (tomorrow’s topic)
Scalar vs Vector Quantities • There are two types of quantities that exist • Scalar quantities – only indicates magnitude (how much) • Speed • Temperature • Vector quantity – indicates magnitude and direction • Velocity • Acceleration
Average Speed Average speed is an example of a scalar quantity because it only indicates the magnitude (how much) of motion, not the direction. Quantities that also indicate a direction are called vector quantities and we will start dealing with them tomorrow.
Average Speed • Uniform motion in a specific time • Using a formula: Average speed = distance travelled time elapsed v = ∆d (∆ means “change in”) ∆t v= average speed d= distance t= time
Example 1: Amber just got her driver's license and decided that a nice way to celebrate that milestone in life would be to grab the keys to her mom's vehicle and drive to Edmonton with her friends. Now, if Edmonton is 150 km away and it took her 80 minutes to travel that far, what was her average speed?
Example 1 Answers • What do we know? • Distance = 150 km • Time = 80 minutes • Great! • What do we need? Velocity
Example 2 Amber remembered that she needed to get home to Athabasca ASAP as her parents didn't know that she borrowed their vehicle... Fortunately, she had only gotten to Clyde, which is 80km from her home. How long (in hours and in minutes) would it take her to get home if she was forced to stay at the speed limit (as a RCMP vehicle was casually tailing her as she drove north)?
Example 2 • What do we know? • d=80 km • v=100km/h • What do we need? Time
Converting Units • The System International (SI) units for speed is m/s • More commonly we measure speed in km/h • To convert from m/s to km/h or the other way: • 1km = m h = s • Convert 5m/s to km/h Convert 15km/h to m/s
Topics Covered • How to interpret graphs • Distance - time graphs • Speed – Time graphs
Graphs • Two types of graphs: • Distance-time graph • Speed-time graph • **Pay attention to which type of graph you are working with!
Making a graph • Important points to remember: • Time always goes on the x-axis (what is the x-axis?) • Label both y and x-axis (with correct units too!) • Make graphs a suitable size (not too small: make a scale) • Graphs must always have a title • Use an appropriate scale for values • Line of best fit: use a ruler
When looking at graphs • The first piece of information is the found on the x axis, then the second piece of information is found on the y axis. • For example: • (0,0); (2.0,10)
Average Speed by Graphing Distance • An average speed graph plots distance vs. time • Time is the manipulated variable and is plotted on the “x” axis • Distance is the responding variable and is plotted on the “y” axis • A “best fit” line goes through the majority of data points on the graph • When the line is straight, we assume that the motion being represented is uniform. • The steeper the slope of the line, the faster the object is traveling. • Average speed can be determined by finding the slope of the line that you have drawn
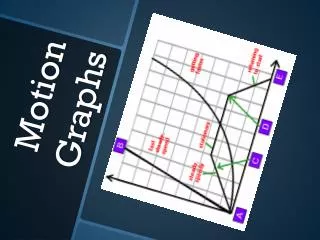
Distance-time graph • Deal with an object’s change in distance an object travels compared to time • Use our reference point • Distance always increases from that point • Slope of line (line of best fit) = average speed of an object • How do we calculate slope? • Rise/Run • For these graphs, • change in distance/change in time
Distance Time Graphs • Rise/Run • For these graphs, • change in distance/change in time • v=∆d/∆t • Slope= Rise/Run • Slope (v) = ∆d/∆t • ∆d = df - di • ∆t = tf - ti
Practice: Calculating Slope Albert was riding on his scooter. His friend recorded his speed.
Practice: Distance-time graph p. 130 Example
Practice • How do we calculate slope? • What are the units of the slope? • What is this unit the same as? • What does a horizontal line on the graph mean? • The object has stopped moving (not changing distance)