Download
1 / 24
250 likes | 692 Views
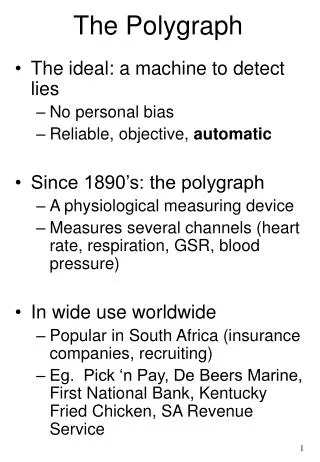
Polygraph Machine. Neil Quinn John Zwarich. Introduction. A polygraph machine is an instrument that simultaneously records changes in physiological processes such as heartbeat, blood pressure, and respiration.

E N D
Polygraph Machine Neil Quinn John Zwarich
Introduction • A polygraph machine is an instrument that simultaneously records changes in physiological processes such as heartbeat, blood pressure, and respiration. • Our project will collect and analyze these signals and output a certainty factor associated with each question.
Initial Objectives • Uses: • Lie detection for a wide variety of users: • Criminal interrogation • Interviewing processes • Employee analysis • Physiological conditions to be measured: • Heart rate • Blood pressure • Respiration rate / depth • Perspiration • Other Features: • Monitoring of signals for health reasons • Healthy values compared to test data • PC based GUI for displaying signals • Adaptive algorithm for better patient compatibility
Initial Specifications Technical Specs: • Heart rate accuracy: >90% • Electrical noise (60hz) must be filtered • Output results within 30 seconds of initial question • Output accuracy exceeding 50%. (random guessing) • Estimated Cost: • Heart Rate/Pressure Transducer ~ $200 • Respiration Transducer ~ $100 • DSP chip and board ~ $300 • Amplifiers ~ $15 • Analogue Filters ~ $10
Building our project Inputs: The initial signal conditioning circuit gave us poor results. Low-Pass Filter Gain = 47 Fc = 33 Hz Differential Op-Amp Gain = 10
Design Review Adjustments made: • amplifier / filter had to be redesigned several times to get a good signal • Physiological signals simplified to heart rate and pressure • DAQ board used to record and output signals for testing purposes • Output of DAQ board needed an additional filter to smooth response
Pressure Transducer Instrumentation Amplifier Low-Pass Filter Final Design High-Pass Filter Amplifier MatLab GUI PC (Labview) TI DSP Oscilloscope
Pressure Transducer • Blood Pressure Cuff to acquire input signal • MicroSwitch 120PC Pressure Transducer to get differential voltage • Pressure Transducer Specs: • 0-5 psi range • 115mV full scale output • Sensitivity: 23mV / psi • 12v supply voltage • response time: 1ms max
Instrumentation Amplifier • More suited for our purposes because: • provides a maximum gain of 4577 • easily adjustable gain • eliminates common mode signals • (from arm movements, etc) • specifically recommended for • pressure sensing lines Vout = ( 1 + 2R/Rg ) (V2 – V1)
Low-Pass Filter Low-Pass Filter, Fc = 24 Hz • This filter design is a Sallen-Keys Butterworth filter design. • Advantages: • Faster rolloff rate because of double pole frequency response • Maximally flat pass-band for desired frequencies
High Pass Filter and Amplifier • Design Advantages: • like LPF, also a Sallen-Keys • Butterworth filter design • - HPF cutoff at 0.1hz • final amplifier gives additional boost • to desired range
Total Signal Conditioning Circuit Low-Pass Filter Fc = 24 Hz High Pass Filter Fc = 0.1 Hz Amplifier Gain = 5 Instrumentation Amplifier Max Gain = 4577
Heartbeat Capture This output also allowed us to measure the peak-to-peak voltage and frequency of the signal from the oscilloscope.
DSP Block Diagram Collect Input Write Sample? Output No Yes Put sample in Buffer Check Verification Update Difference and Threshold Windowing MATLAB Compare Frequency to Weighted Average of Past Frequencies FFT Equalization Find Frequency W/ Highest Amplitude
Frequency Response of DSP • Input Frequency Response of DSP was non linear • Equalized response in DSP Code by multiplying each fft bin by appropriate gain
Testing Phase • Used Labview 6i to collect data through PCI-MIO-16E DAQ • Waveforms stored to files and played back • Files could be converted to spreadsheet format for analysis • Analog output required a LPF Readfile.vi -Reads waveform file -Outputs to channel 21 (DAC0out) • Writefile.vi • -Scans analog input from channel 68 (ACH0) • Writes data to waveform file
Analog Output Adjustment Low-Pass Filter Fc = 5hz Filtered to avoid zero-order hold effects
Data Samples Region 1 – True Answer Region 2 – False Answer Region 3 – True Answer
Accomplishments • Demonstrated functionality of overall circuit in detecting lies • Identified ~80% of lies of testing set • Misidentified ~14% of truths as lies • Far exceeds 50% accuracy expected from random guessing • Signal conditioning circuitry successfully amplified and filtered data to suitable range for processing • Demonstrated adaptability across subjects by adjusting to individuals’ average heart rate and physiological responses • Greatly reduced cost from initial estimation
Challenges • Initial amplifier and filters redesigned for better performance • Amplifier instrumentation amp (common mode) • LPF a higher-order design for better dB attenuation slope • Input circuitry overly sensitive to the subject’s arm movements • 2 Pressure sensors pins got cracked off in testing phase • Labview 6i • Wrote a custom program for reading in waveform • Analog output needed a LPF • Poor documentation • Op-amps clipped with subject movement due to high gain on amplifiers • DSP AC coupling required equalization for low frequencies within the routine
Other Tests / Recommendations • Given more time, we would have liked to collect sample data from a wider range of subjects • It may have been better to spend more money to purchase an amplified pressure sensor to speed up construction of hardware • More physiological inputs may improve results (respiration, electro-dermal) • Investigate other algorithms for low frequency spectral analysis (zero crossing, peak counting)