Download
1 / 31
320 likes | 493 Views
Keynote Presentation at WASTEENG 2014 Rrio de Janeiro, August 25-28. Comparison of Transport and Reaction Phenomena in Waste-to-Energy (WTE) Power Plants. Prof. Nickolas J. Themelis , Director, and Olivier L.R. Morin, Research Associate.

E N D
Keynote Presentation at WASTEENG 2014 Rrio de Janeiro, August 25-28 Comparison of Transport and Reaction Phenomena in Waste-to-Energy (WTE) Power Plants Prof. Nickolas J. Themelis, Director, and Olivier L.R. Morin, Research Associate
Origin of this study: Comparison of geometry and operating parameters of existing MSW and biomass WTE operations Fluid bed power plants burning wood chip slurries (40% water): Heat flux of 4-9 MW/m2; Moving Grate power plants burning MSW (30% water: Heat flux of 1-2 MW/m2
+ +120 kWh,el/ton + 0.6 MWel +0.1MWel The EEC hierarchy of waste management
Energy recovery from “wastes”(waste-to energy or WTE) is equivalent to recycling • Today, several countries such as Japan, Austria, Switzerland, Germany, the Netherlands, Korea and Singapore use WTE as the main process for treating post-recycling municipal solid wastes (MSW).
Estimated global disposition of urbanpost-recycling municipal solid wastes (total: 1.2 billion tons; 2012) • Thermal treatment (WTE): 200 mill. tons • Sanitary landfill, partial CH4 recovery: 200 mill. tons • Landfilled without CH4 recovery: >800 mill. tons • Estimated land use for sanitary landfilling: • 10 tons MSW per square meter
There are only two options for managing post-recycling wastes: Sanitary landfill or thermal treatment (WTE) WTE advantages: • Conservation of land near cities • Energy recovery: 0.5 MWh/ton, over LFG recovery • Reduction of Greenhouse Gas (GHG) emissions: 0.5-1 ton CO2 per ton MSW (vs landfilling) • Esthetically more acceptable to communities; in fact only acceptable option in most developing countries.
There are only two options for managing post-recycling wastes: Sanitary landfill or thermal treatment (WTE) WTE disadvantages: • Dissemination of wrong information by some environmental organizations (“God recycles but devil burns”) • Some of these organizations were formed at a time (before 1990) when incinerators were major emitters of heavy metals and dioxins. However, their opposition has not changed as the Air Pollution Control systems of WTEs have improved to the point that total toxic emissions of WTEs have decreased by factors of 1000 to 10000. For example total toxic dioxin emissions of U.S. are now <5 grams/year. • Initial capital investment
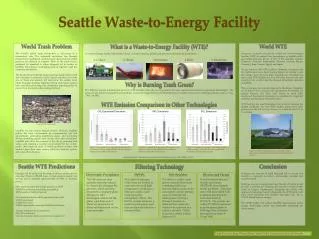
Waste-to-Energy (WTE) Facility Reducing the Volume of Waste & Generating Energy 13,000 KWh generated 90% volume reduction OUT 10 cubic yards of (inert) ash IN 100 cubic yards of waste E = M x C2 Energy is mass times a constant
The economics of WTE plants – Sources of revenues • Both sanitary landfills and WTE plants need a “gate fee” (e.g., $/ton) to support them. • This fee ranges from $100/ton MSW, in some highly developed nations, to as low as $20/ton for partially sanitary landfilling in Latin America. • The second source or revenue for WTE plants is the sale of WTE electricity; for Latin America it is projected to be about $50/ton MSW.
The economics of WTE plants – Sources or revenues (cont.) • Truly sanitary landfills can recover methane gas and use it to produce electricity. Generally, this amounts to about 0.1 MWh/ton MSW, i.e. about $10/ton.
The economics of WTE plants: Revenues • According to the numbers presented earlier, future WTE plants in Latin America will enjoy a revenue of $70/ton of MSW, while the revenue of sanitary landfills will be only $30. • However, what tips the balance in favor of sanitary landfilling is the high capital cost of WTE plants.
A WTE problem: Capital investment • In contrast to landfills, which can be expanded year after year (“cell by cell”), a WTE plant requires an initial, very large investment. • Therefore, in a less than five years horizon, a community needs to spend a much smaller sum to start a sanitary landfill than a WTE power plant.
The economics of WTE plants – The cost of repaying the capital investment • Modern WTE plants, equipped with Air Pollution Control systems that meet the E.U./U.S. standards cost over $600/ton of annual capacity. • In order to pay this amount back over a period of 20 years (usual contract) requires a capital charge of about $60/ton. • Therefore, communities who only pay a “gate fee” of $20/ton MSW cannot afford a WTE plant.
CONCLUSION FOR LATIN AMERICA:It is necessary to use a WTE technology that requires a lower capital investment than the Moving Grate technologies offered currently
Most common WTE technology: Combustion on moving grateOver 700 operating plants. In 2000-1012, there were built over 120 new grate combustion plants (over 25 million tons of new capacity) Emerging WTE technology: Circulating Fluid Bed Developed and used mostly in China: Suitable for high organic, high moisture urban wastes(Zhejiang University, Hangzhou:Chinese Academy of Sciences, Beijing)
Reasons for dominance of Moving Grate WTE • Simplicity of operation • Technology gradually developed over 100 years and constantly advancing • Very high plant availability (>8,000 hours per year • Low personnel requirement (<70 for a one-million tons/year plant) and ease of training of personnel of new plants
Three types of Moving Grate systems 30 26o Inlet FB1 Inlet RB1 Outlet 30o Outlet Forward Acting Grate (FAG) -Von Roll type - Inlet of MSW RBn: reciprocating bar roller FBn: fixed bar FB1 RB1 Outlet of Ash Roller Grate (RG) - Duesseldorf/Babcock Grate - Main differences RBn: reciprocating bar FBn: fixed bar Reverse Acting Grate (RAG) - Martin type -
MSW Size Distribution and Cumulative Distributions MSW Particle Size Distribution Cumulative Distributions Cumulative Density Distribution of Gamma Function F(d): Particle Size Cumulative Density Distribution of Gamma Function F(d3): Particle Volume Source: M. Nakamura, M.J. Castaldi, and N.J. Themelis, "Numerical Analysis of size reduction of municipal solid waste particles on the traveling grate in a waste-to-energy combustion chamber," Proc. 14th annual North American Waste To Energy Conference (NAWTEC14), pp. 125-130, Tampa, FL (2006)
Smaller MSW particle size increases greatly the rates of heat transfer and combustion Temp, K T=773 K T=973 K T=1173 K Source: Nakamura M. , Zhang H. , Millrath K. , and Themelis N. J. , "Modeling of Waste-to-Energy Combustion with Continuous Variation of the Solid Waste Fuel," 2003 ASME ICMEE, Washington, D.C. (2003) From Masato Nakamura PhD Thesis, Columbia University, 2008: Rx time for 95% combustion proportional to (dparticle)1.62
What is a Fluidized Bed? • It is an operation blowing solid particle swarms with gas or liquid, making solid particles turn into fluid-like state. • The gravity on the particles is offset by drag imposed on fluid, so particles are at the state of semi-suspended. With the addition of airflow speed, solid particles show different flow state.
Types of MSW Fluid Bed furnaces Circulating fluidized bed is more suitable and originally developed for low heating value waste.
In contrast to MG, CFB requires shredding of the MSWShredding, as applied in the RDF WTE plants in the 20th century, was by means of hammermills; it was complex and very costly in construction and operation
Low-speed, high-torque shredders have been developed since the U.S. RDF plants of the early nineties
Cixi WTE advance: Low-Speed, High-Torque shredder is part of MSW bunker. Shredder is fed as-received MSW by overhead crane and shredded outflow is fed by crane to CFB unit. Shredder energy: <10 kWh/ton MSW
The CFB technology of Zhejiang University for burning materials of: • Particles in ZJU CFB are engaged in two flows:r • Heavier particles are reacted in bubbling flow; • lighter, smaller particles are reacted in circulating flow • Different density • Different size • High moisture fuel outer cycle Bubbling flow Exit point of bottom ash Schematic diagram of CFBI
Comparison of various WTE plants in China(Huang, Chi, and Themelis, 2013)
Waste to energy (WTE) plants in China (ref. Zheng, 2014) • 77 plants use Moving Grate MG) technology • 59 plants use Fluidized Bed Combustion technology (Zhejiang, U,; Chinese Academy of Sciences: TsingHua U.) • Total operating WTE/incineration plants: 136 • The Cixi 899 ton/day unit is based on Zhejiang U. technology.
Very rough capital investment costs (ref. various sources including Columbia thesis of Ling Qiu (2013)
If you are interested in learning more about CFB and WTE: • Try to attend the ICIPEC International Conference in Hangzhou, China, October 14-17 (www.icipec2014.org) • Try to attend the WTERT 2014 Meeting at Columbia University in the City of New York, October 9-10 (www.wtert.org).