Download
1 / 24
240 likes | 500 Views
K Means Clustering , Nearest Cluster and Gaussian Mixture. Presented by Kuei-Hsien 2005.06.23. K Means Clustering. Clustering algorithms are used to find groups of “similar” data points among the input patterns.

E N D
K Means Clustering , Nearest Cluster and Gaussian Mixture Presented by Kuei-Hsien 2005.06.23
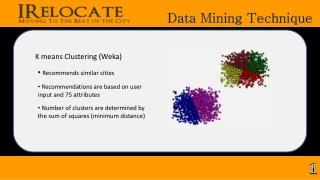
K Means Clustering • Clustering algorithms are used to find groups of “similar” data points among the input patterns. • K means clustering is an effective algorithm to extract a given number of clusters of patterns from a training set. • Once done, the cluster locations can be used to classify data into distinct classes.
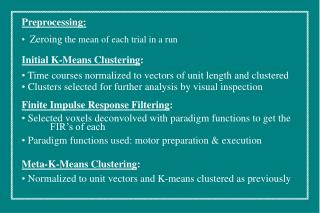
For each cluster, recompute its center by finding the mean of the cluster: Where Mk is the new mean, Nk is the number of training patterns in cluster k, and Xjk is the k-th pattern belonging to cluster . Loop until the change in cluster means is less the amount specified by the user. K Means Training Flow Chart Initialize the number of cluster centers selected by the user by randomly selecting them from the training set. Classify the entire training set. For each pattern Xi in the training set, find the nearest cluster center C* and classify Xi as a member of C*.
If the number of cluster centers is less then the number specified, split each cluster center into two clusters by finding the input dimension with the highest deviation: Where Xij is the i-th dimension of the j-th pattern in cluster k, Mij is the i-th dimension of the cluster center, and Nk is the number of training patterns in cluster k. Store the k cluster centers.
Random select k cluster centers locations • Ask User how many clusters they’d like. (e.g. k=5). • Each datapoint finds out which Center it’s closest to. (Thus each Center “owns” a set of datapoints) • Each cluster fine the centroid of the points it owns. • …and jumps to there • …repeat step 3 to 5 until terminated
Stop Condition-Splitting & Merging Splitting SD is large and SD change is less than a specified value The means of clusters are too close Merging Loop until the change of SD in all clusters are less than a specified value by user, or when a specified number of epochs have been reached.
Stop Condition- training of parameter For each pattern X, associate X with the cluster Y closest to X using the Euclidean distance: Euclidean distance: Loop until the change in all cluster means is less the amount specified by the user K Means Test Flow Chart
Commonly tunable parameters for K means • Number of initial clusters • Randomly chosen • Number of cluster centers • 2~√N • Criteria for splitting and merging cluster centers • Number of epochs or percent of SD change • Stop conditions • The stop condition Binary splitting is less important than that for the overall clustering. K Means Clustering End
Nearest Cluster • The nearest-cluster architecture can be viewed as a condensed version of the K nearest neighbor architecture. • This architecture can often deliver performance close to that of KNN, while reducing computation time and memory requirements.
Nearest Cluster • The nearest-cluster architecture involves a partitioning of the training set into a few clusters. • For a given cluster, these values estimate the posterior probabilities of all possible classes for the region of the input space in the vicinity of the cluster. • During classification, an input is associated with the nearest cluster, and the posterior probability estimates for that cluster are used to classify the input.
For each cluster, generate a probability for each class according to: Where Pjk is the probability for class j within cluster k, Njk is the number of class-j patterns belonging to cluster k, and Nk is the total number of patterns belonging to cluster k. Nearest Cluster Training Flow Chart Perform K means clustering on the data set.
For each input pattern, X, find the nearest cluster Ck, using the Euclidean distance measure: Where Y is a cluster center and m is the number of dimensions in the input patterns. Nearest Cluster Test Flow Chart Use the probabilities Pjk for all classes j stored with Ck., and classify pattern X into the class j with the highest probability.
Class 1 Class 2 Nearest Cluster h In cluster 1: Pclass1=100% Pclass2=0% In cluster 2: Pclass1=99.5% Pclass2=0.5% In cluster 3: Pclass1=50% Pclass2=50% In cluster 5: Pclass1=65% Pclass2=35% In cluster 4: Pclass1=15% Pclass2=85% Pclass1=65% Nearest Cluster End
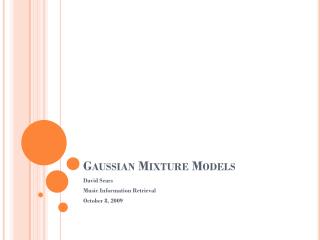
Where P(X | Ci) is the PDF of class j, evaluated at X, P( Cj ) is the prior probability for class j, and P(X) is the overall PDF, evaluated at X. Gaussian Mixture • The Gaussian mixture architecture estimates probability density functions (PDF) for each class, and then performs classification based on Bayes’ rule:
Gaussian Mixture • Unlike the unimodal Gaussian architecture, which assumes P(X | Cj) to be in the form of a Gaussian, the Gaussian mixture model estimates P(X | Cj) as a weighted average of multiple Gaussians. Where wk is the weight of the k-th Gaussian Gk and the weights sum to one. One such PDF model is produced for each class.
Gaussian Mixture • Each Gaussian component is defined as: Where Mk is the mean of the Gaussian and Vk is the covariance matrix of the Gaussian..
Gaussian Mixture • Free parameters of the Gaussian mixture model consist of the means and covariance matrices of the Gaussian components and the weights indicating the contribution of each Gaussian to the approximation of P(X | Cj).
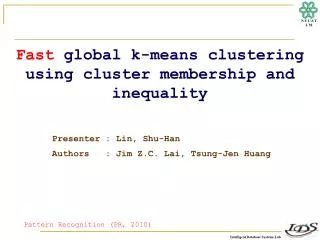
G2,w2 G1,w1 G3,w3 G5.w5 G4,w4 Composition of Gaussian Mixture Class 1 Variables: μi, Vi, wk We use EM (estimate-maximize) algorithm to approximate this variables.
Gaussian Mixture • These parameters are tuned using a complex iterative procedure called the estimate-maximize (EM) algorithm, that aims at maximizing the likelihood of the training set generated by the estimated PDF. • The likelihood function L for each class j can be defined as:
Gaussian Mixture Training Flow Chart (1) Initialize the initial Gaussian means μi, i=1,…G using the K means clustering algorithm Initialize the covariance matrices, Vi, to the distance to the nearest cluster. Initialize the weights πi =1 / G so that all Gaussian are equally likely. Present each pattern X of the training set and model each of the classes K as a weighte sum of Gaussians: Where G is the number of Gaussians, the πi’s are the weights, and Where Viis the covariance matrix.
Compute: Iteratively update the weights, means and covariances: Gaussian Mixture Training Flow Chart (2)
Gaussian Mixture Training Flow Chart (3) Recompute τip using the new weights, means and covariances. Stop training if Or the number of epochs reach the specified value. Otherwise, continue the iterative updates.
Present each input pattern X and compute the confidence for each class j: Where is the prior probability of class Cjestimated by counting the number of training patterns. Classify pattern X as the class with the highest confidence. Gaussian Mixture Test Flow Chart Gaussian Mixture End