Download

1 / 42
560 likes | 1.12k Views
CZ5225: Modeling and Simulation in Biology Lecture 4: Clustering Analysis for Microarray Data II Prof. Chen Yu Zong Tel: 6874-6877 Email: yzchen@cz3.nus.edu.sg http://xin.cz3.nus.edu.sg Room 07-24, level 7, SOC1, NUS. K-means clustering. This method differs from the hierarchical clustering

E N D
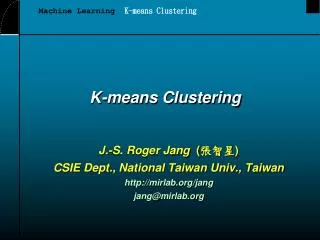
CZ5225: Modeling and Simulation in BiologyLecture 4: Clustering Analysis for Microarray Data IIProf. Chen Yu ZongTel: 6874-6877Email: yzchen@cz3.nus.edu.sghttp://xin.cz3.nus.edu.sgRoom 07-24, level 7, SOC1, NUS
K-means clustering • This method differs from the hierarchical clustering • in several ways. In particular: • There is no hierarchy, the data are partitioned. You will be presented only with the final cluster membership for each case. • There is no role for the dendrogram in k-means clustering. • You must supply the number of clusters (k) into which the data are to be grouped.
Example of K-means algorithm:Lloyd’s algorithm • Has been shown to converge to a locally optimal solution • But can converge to a solution arbitrarily bad compared to the optimal solution Data Points Optimal Centers Heuristic Centers K=3
K-means clustering • Given a set of n data points in d-dimensional space and an integer k • We want to find the set of k points in d-dimensional space that minimizes the mean squared distance from each data point to its nearest center • No exact polynomial-time algorithms are known for this problem
K-means clustering • Usually uses Euclidean distance • Gives spherical clusters • How many clusters, K? • Solution is not unique, clustering can depend on your starting point
K-means clustering Step 1: Transform n (genes) * m (experiments) matrix into n(genes) * n(genes) distance matrix Step 2: Cluster genes based on a k-means clustering algorithm
K-means clustering To transform the n*m matrix into n*n matrix, use a similarity (distance) metric. (Tavazoie et al. Nature Genetics. 1999 Jul;22:281-5) Euclidean distance Where any two genes X and Y observed overa series of M conditions.
1 2 2 1 3 4 1 2 K-means clustering
K-means clustering algorithm Step 1: Suppose distance of genes expression patterns are positioned on a two dimensional space based a distance matrix Step 2: The first cluster center(red) is chosen randomly and then subsequent centers are by finding the data point farthest from the centers already chosen. In this example, k=3.
K-means clustering algorithm Step 3: Each point is assigned to the cluster associated with the closest representative center Step 4: Minimizes the within-cluster sum of squared distances from the cluster mean by moving the centroid (star points), that is computing a new cluster representative
K-means clustering algorithm Step 5: Repeat step 3 and 4 with a new representative Run step 3, 4 and 5 until no further changes occur – Self-consistency reached
Basic Algorithm for K-Means • Choose K initial cluster centers at random • Partition objects into k clusters by assigning objects to the closest centroid • Calculate the centroid of each of the k clusters. • Assign each object to cluster i, by first calculating the distance from each object to all cluster centers, choose closest. • If object changes clusters, recalculate the centroids • Repeat until objects not moving anymore.
Euclidean Distance and Centroid Point Simple and Fast! Remember this when we consider the complexity! The above equation is used to find the n dimensional centroid point amid k n dimensional points:
K-means 2nd example with k=2 • We Pick k=2 centers at random • We cluster our data around these center points
K-means 2nd example with k=2 • We recalculate centers based on our current clusters
K-means 2nd example with k=2 • We re-cluster our data around our new center points
K-means 2nd example with k=2 We repeat the last two steps until no more data points are moved into a different cluster
K-means clustering problems • Random initialization means that you may get different clusters each time • Data points are assigned to only one cluster (hard assignment) • Implicit assumptions about the “shapes” of clusters • You have to pick the number of clusters…
K-means problem: distance may not always accurately reflect relationship • Each data point is assigned to the correct cluster • But data points that seem to be far away from each other in heuristic are in reality very closely related to each other
Tips on improving K-means clustering: to split/combine clusters • Variations of the ISODATA algorithm • Split clusters that are too large by increasing k by one • Merge clusters that are too small, by merging clusters that are very close to one another • What is too close and too far?
Tips on improving K-means clustering:Use of K-mediods instead of centroids • Kmeans uses centroids, average of samples in a cluster • Mediod: “representative object” within a cluster • Less Sensitive to outliers
Tips on improving K-means clustering: How to choose k? • Use another clustering method • Run algorithm on data with several different values of k, and look at the stability of the results • Use advance knowledge about the characteristics of your test
Tips on improving K-means clustering: Choosing K by using Silhouettes • Silhouette of a gene, i, is: • ai: average distance of sample, i, to other samples in the same cluster • bi: average distance of sample, i, to genes in the nearest neighbor cluster • maximal average Silhouette width can be used to select the number of clusters, s(i) close to one are well-classified
Tips on improving K-means clustering: Choosing K by using Silhouettes k=2 k=3
Tips on improving K-means clustering: Choosing K by using WADPweighted average discrepancy pairs • Add noise (perturbations to original data) • Calculate the number of paired samples that cluster together in the original cluster that didn’t get perturbed • Repeat for every cutoff level in HC or each k in k-means • Estimate the proportion of pairs that changes for each k • Use different levels of noise (heuristic) • Look for largest k before WADP gets large
Tips on improving K-means clustering: Choosing K by using Cluster Quality Measures • By introducing a measure of cluster quality Q, different values of k can be evaluated until an optimal value of Q is reached • But, since clustering is an unsupervised learning method, one can’t really expect to find a “correct” measure Q… • So, once again there are different choices of Q and our decision will depend on what dissimilarity measure are used and what types of clusters we want
Tips on improving K-means clustering: Choosing K by using Cluster Quality Measures • Jagota suggested a measure that emphasizes cluster tightness or homogeneity: • |Ci | is the number of data points in cluster i • Q will be small if (on average) the data points in each cluster are close
Tips on improving K-means clustering: Choosing K by using Cluster Quality Measures This is a plot of the Q measure as given in Jagota for k-means clustering on the data shown earlier How many clusters do you think there actually are? Q k
Tips on improving K-means clustering: Choosing K by using Cluster Quality Measures • The Q measure given in Jagota takes into account homogeneity within clusters, but not separation between clusters • Other measures try to combine these two characteristics (i.e., the Davies-Bouldin measure) • An alternate approach is to look at cluster stability: • Add random noise to the data many times and count how many pairs of data points no longer cluster together • How much noise to add? Should reflect estimated variance in the data
What makes a clustering good? • Clustering results can be different for different methods and distance metrics • Except in the simplest of cases, result is sensitive to noise and outliers in the data • Like the case of differential genes, looking for • Homogeneity: similarity within a cluster • Separation: differences between clusters
What makes a clustering good?Hypothesis Testing Approach • Null hypothesis is that data has NO structure • Generate a reference data population under the random hypothesis, data models a random structure and compare it to the actual data • Estimate a statistic that indicates data structure
Cluster Quality • Since any data can be clustered, how do we know our clusters are meaningful? • The size (diameter) of the cluster vs. The inter-cluster distance • Distance between the members of a cluster and the cluster’s center • Diameter of the smallest sphere
Cluster Quality distance=5 size=5 distance=20 Quality of cluster assessed by ratio of distance to nearest cluster and cluster diameter size=5
Cluster Quality Quality can be assessed simply by looking at the diameter of a cluster A cluster can be formed even when there is no similarity between clustered patterns. This occurs because the algorithm forces k clusters to be created.
Characteristics of k-means clustering • The random selection of initial center points creates the following properties • Non-Determinism • May produce clusters without patterns • One solution is to choose the centers randomly from existing patterns
K-means clustering algorithm complexity • Linear relationship with the number of data points, N • CPU time required is proportional to cN • c does not depend on N, but rather the number of clusters, k • Low computational complexity • High speed