Download
1 / 39
400 likes | 525 Views
A Process for Integrating Quality and Process Efficiency. Dr. David C. Oehler Director of Assessment, Information and Analysis Northwest Missouri State University. Founded 1905 Masters I Colleges: 3 Departments: 19 5,400 undergraduates 1,000 graduate students 43% live on-campus.

E N D
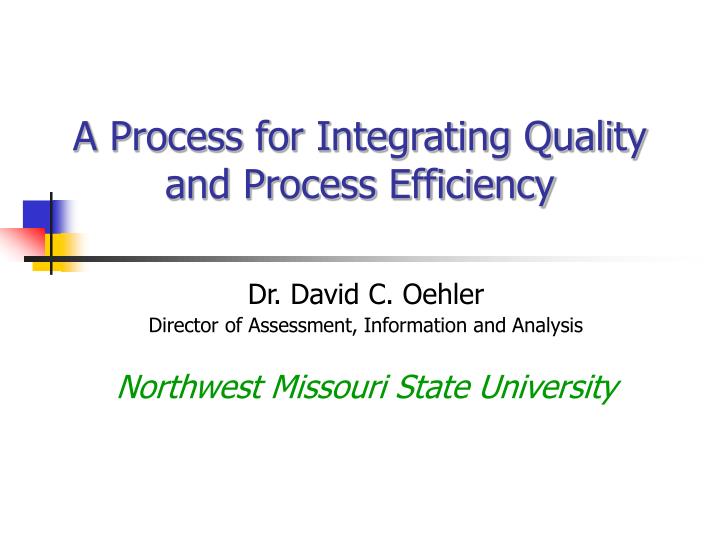
A Process for Integrating Quality and Process Efficiency Dr. David C. Oehler Director of Assessment, Information and Analysis Northwest Missouri State University
Founded 1905 Masters I Colleges: 3 Departments: 19 5,400 undergraduates 1,000 graduate students 43% live on-campus 56% female 45% first generation 10% minority/internat’l 29 other states 27 foreign countries Incoming ACT 22.2 (20.9 is nat’l median) 77% F05 freshmen in upper ½ of HS class Northwest Missouri State Univ. NCCI Annual Conference
Background of project • Allegations that Hg. Ed. funding is poorly used • Demands for accountability • State budget stress • Cuts in funding • Typical responses • Efforts to increase revenue • Across-the-board cuts • Vertical cuts • Alternative: Reengineering processes NCCI Annual Conference
Challenge: costs and quality measured using different variables • Sloan grant • Datatel support • Pilots and applications NCCI Annual Conference
Objectives of this presentation • Overview the Hubbard Cycle (Q/ABC Process) • Highlight some of the approaches used in implementing the Cycle NCCI Annual Conference
History of 7-Step Process • Developed in 1992 • Incorporates all of the elements of the Baldrige Criteria • Non-prescriptive • Logical • Cyclic NCCI Annual Conference
Overview of Issues • Clarity & alignment of overall goals • Fact-based decision making • Systemic, process-oriented design • Improvement design based on a proven model NCCI Annual Conference
Clarity and alignment of overall goals • Who is it that judges the quality of what you do? • What are their expectations? • What attributes or characteristics should students possess when completing your program? • What attributes or characteristics are associated with high quality service for your area? Step 1 – Define & Validate Key Quality Indicators (KQIs) Step 2 – Establish Goals and Objectives NCCI Annual Conference
Fact-based decision making • How do you know how well you are doing? • What can you measure to monitor your performance? • How does this compare to appropriate competitors? Step 3 – Formulate an Assessment Strategy NCCI Annual Conference
Systemic, process-oriented design • How do you “deliver” quality? • How are your programs/services designed to meet the expectations of your customers/clients? Step 4 – Develop an Action Plan and Deployment Strategy Step 5 – Establish Baselines; Track Performance Trends NCCI Annual Conference
Improvement design based on a proven model • What performance improvement targets are reasonable? • Given your relative performance comparison, what is a reasonable performance target? Step 6 – Search for Better Practices Step 7 – Set Performance Targets and/or Stretch Goals NCCI Annual Conference
Seven Steps • Define and Validate Key Quality Indicators • Establish Process Goals and Objectives • Formulate an Assessment Strategy • Develop and Implement an Action Plan and Deployment Strategy • Establish Baselines; Track Performance Trends • Search for Better Practices • Set Performance Targets and/or Stretch Goals NCCI Annual Conference
2 types of activities • Continuous Quality Improvement (CQI) Activities • Cost Analysis (CA) Activities NCCI Annual Conference
History of Activity-Based Costing • Term “activity-based costing” coined in 1975 by Dr. Robert Kaplan • Resulted from dissatisfaction with traditional accounting categories • Identifies activities as the fundamental cost object of an organization • Widely used in industries (e.g. FedEx, Texas Instruments…) NCCI Annual Conference
Benefits Associated With ABC • More accurate cost information • Improved cost control and management • Improved insight into cost causation • Better performance measures NCCI Annual Conference
Benefits Associated with Applying The Hubbard Cycle • Forces cost reduction discussions to consider the impact on students/stakeholders • Facilitates a “value added” approach to discussions of quality and cost • Stimulates a more profound discussion of costs in relation to quality • Adds sophistication to an institution’s planning process by promoting impact and analysis activities • Can assist an educational institution in developing more mature accountability models to address every-increasing state and federal mandates. NCCI Annual Conference
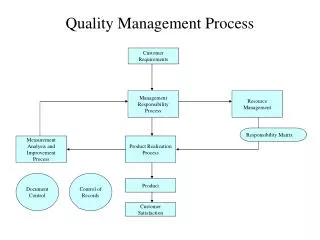
Fundamental Understanding • All work is process. • A process is a sequentially linked set of activities designed to produce a desired outcome. • The key to effective process management is to have clear quality measures against which efficiency and effectiveness can be gauged. • Processes function within larger systems. NCCI Annual Conference
HUBBARD CYCLE PROCESS MODEL UNCONTROLLED VARIABLES MODULE (KQIs) Time ACTIVITY (Cost Drivers) Resources ACTIVITY (Cost Drivers) COST/ BENEFIT ANALYSIS VALUE- ADDING OUTCOMES ACTIVITY (Cost Drivers) NON VALUE-ADDING OUTCOMES ACTIVITY (Cost Drivers) ACTIVITY-BASED COST ANALYSIS QUALITY ASSESSMENT ACTIVITY (Cost Drivers)
Applying The Hubbard Cycle… NCCI Annual Conference
CQI Activities Segment students/ stakeholders Identify needs and expectations Formulate KQIs Validate KQIs Link to Institution’s Strategic KQIs Cost Analysis Activities List the activities that make up the process 1: Define and Validate Key Quality Indicators NCCI Annual Conference
What is Quality Service? Perceptions Quality Service Expectations NCCI Annual Conference
Quality is Perceived When… • Most expectations are met and • A few expectations are exceeded NCCI Annual Conference
Educational KQIs • Communications Competencies • Problem Solving Competencies • Critical/Creative Thinking Competencies • Computer Competencies • Self-Directed Learning Competencies • Competence in a Discipline • Personal/Social Development • Team Work/Team Leading Competencies • Multicultural Competencies • Cultural Enrichment NCCI Annual Conference
Service KQIsNorthwest Missouri State University recognizes that quality service is an essential component of a quality university. Furthermore, we acknowledge that all of us – students, faculty, staff, and administration – are at time providers and at other times recipients of services. Accordingly, we pledge our best efforts to provide quality service to you by: • Treating you with respect, fairness, and honesty. Making you feel important and earning your trust. • Performing our tasks with competence and skill. Giving you confidence in the quality of what we provide. • Communicating clearly and courteously the services provided. Making it easy for you to know what you can expect. • Listening actively to your requests, comments, and concerns. Making it easy for you to tell us what you need. • Being flexible and open to new ideas. Accepting you and valuing your knowledge. • Providing what we agree to deliver in a timely manner. Enabling you to depend on us to help meet your goals. • Maintaining a safe and orderly, healthy, well-functioning and attractive campus. Providing you with a safe and pleasant environment in which to learn and work. NCCI Annual Conference
Enrollment KQIs • We will serve place-bound learners through cooperative efforts with other post-secondary institutions and through web-based offerings. • We will continue to expand our primary catchment area with a special focus on Kansas City. • We will continue to recruit an expanding number of traditional students who meet our moderately selective admissions standards. • We will identify and recruit Missouri’s academically gifted sophomore high school students for admittance to the Missouri Academy of Science, Mathematics, and Computing. • We will emphasize diversity in our applicant pool by making special efforts to attract minorities, international students, and first generation college applicants. NCCI Annual Conference
Financial KQIs • We will maintain sufficient E&G reserves to allow for internal borrowing and to cushion downturns in the economy. • We will maintain sufficient Auxiliary reserves to sustain a 3A bond rating. • We will receive annually our share of state support relative to our in-state peers. • Private support from the Northwest Foundation will increase relative to state support and tuition. • We will competitively compensate our faculty and staff relative to our peers. • We will strive to be a leader in efficiency among our peers as measured by the proportion of our budget expended for instruction. • We will maintain the historic beauty of our campus and facilities through a systematic program of renovation and restoration. NCCI Annual Conference
CQI Activities Set goals Establish objectives for each goal Flowchart the process needed to achieve the objectives Cost Analysis Activities Flowchart the process 2: Establish Goals and Performance Targets NCCI Annual Conference
The Hubbard Cycle Process Map PROCESS INPUTS ACTIVITIES OUTPUTS RECIPIENTS (Activities required to produce the outputs) • Another process • Students • Faculty • Other stakeholders • (Internal or external) (Learning and Services) • Environment • People • Materials • Equipment/ • Facilities • Policies/Procedures Key Cost Indicators Key Performance Indicators Key Satisfaction Indicators • Activity Costs • Comparisons • Ratios • Service • Reliability • Timeliness • Learning • Tests • Comparisons • Service • Ease of Interaction • Tangibles • Learning • Instruction • Advising Quality and Cost Analysis
CQI Activities Identify satisfaction and performance measures and indicators Decide on the type of assessment Determine frequency of assessment Specify the audience for results Describe the intended usage of results Cost Analysis Activities Modularize the process (if necessary) Link the KQIs from Step 1 for the module/process 3: Formulate an Assessment Strategy NCCI Annual Conference
CQI Activities Assign responsibility Develop a deployment strategy Develop a training strategy Develop a communications strategy Cost Analysis Activities Log the resources consumed by each activity Determine the unit cost of each cost driver 4: Develop and Implement an Action Plan and Deployment Strategy NCCI Annual Conference
Q/ABC Activity Costing Shell (Time + Resources =Cost Driver) Process: ____________________________________________________________ Activity # Description Time Resources Cost
CQI Activities Measure results of the process to establish the baseline Track performance trends Cost Analysis Activities Calibrate the total cost of the module/process 5: Establish Baseline; Track Performance Trends NCCI Annual Conference
CQI Activities Brainstorm ways to improve the process Do root cause analysis Analyze each activity (Eliminate? Shorten? Substitute technology? Substitute lower-cost effort? Do competitive comparisons Benchmark others’ processes Cost Analysis Activities Search for better (more efficient) activities Construct a new flowchart Estimate the cost of the refined process 6: Search for Better Practices NCCI Annual Conference
Service Quality Root Cause Assessment Model Needs Setting Experience Reputation Commitments Expectations CUSTOMER Perceptions Gap 5 Actual Performance Gap 1 Gap 4 PROVIDER Quality Standards, Specifications, Training Gap 2 & 3 Failure to Understand Expectations Adapted from Delivering Quality Service
Root Cause Analysis--Academic • Do the results reflect what the students’ really know? • How well is the test aligned with the department’s objectives? • Are we providing the learning opportunities necessary to do well on the test? • Are we presenting the material but the students aren’t learning it? NCCI Annual Conference
Cost/Benefit Analysis Four Questions: • Could this activity be eliminated? • Could this activity be shortened? • Could technology be substituted for human effort to accomplish this activity? • Could lower-cost effort be substituted for higher-cost effort to accomplish this activity? NCCI Annual Conference
CQI Activities Set new performance targets based upon the search for better practices Set stretch goals as appropriate Develop an approach for achieving the new targets by combining the best of the old and new processes Cost Analysis Activities Go back to Step 3: Review/revise the assessment strategy, develop an action plan and deployment strategy 7: Set Performance Targets and/or Stretch Goals NCCI Annual Conference
Contact Information • Dave Oehler • Northwest Missouri State University • 800 University Drive • 660.562.1527 (voice) • oehler@nwmissouri.edu NCCI Annual Conference