Download
1 / 25
250 likes | 257 Views
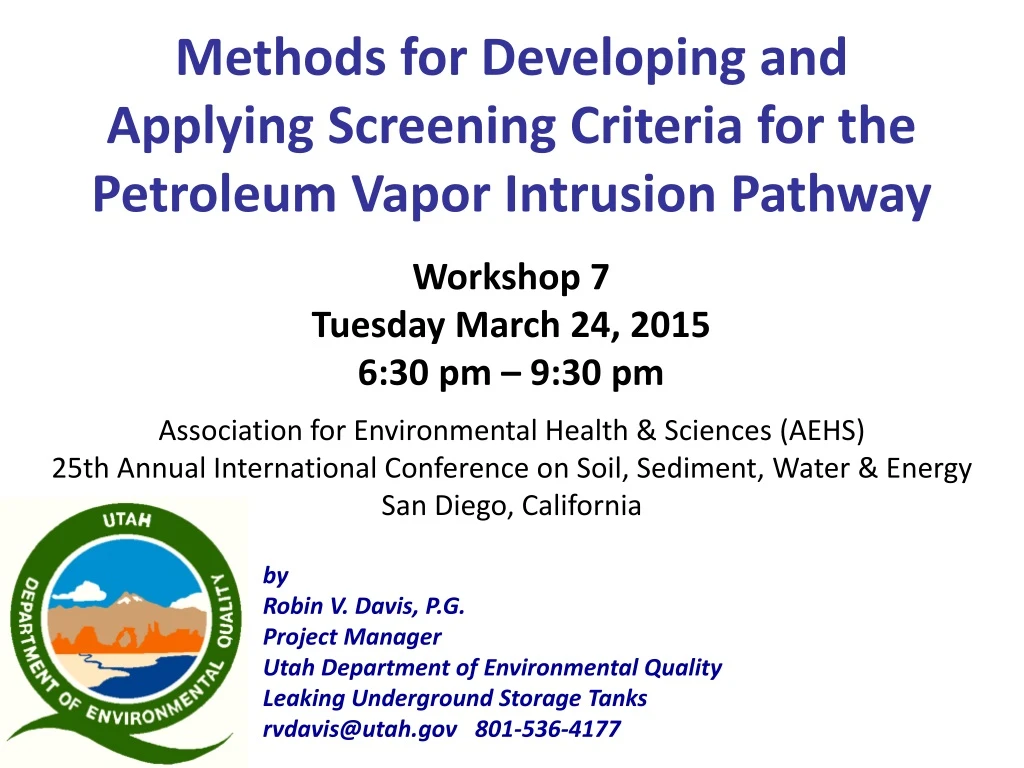
Methods for Developing and Applying Screening Criteria for the Petroleum Vapor Intrusion Pathway. Workshop 7 Tuesday March 24, 2015 6:30 pm – 9:30 pm. Association for Environmental Health & Sciences (AEHS) 25th Annual International Conference on Soil, Sediment, Water & Energy

E N D
Methods for Developing and Applying Screening Criteria for the Petroleum Vapor Intrusion Pathway Workshop 7 Tuesday March 24, 2015 6:30 pm – 9:30 pm Association for Environmental Health & Sciences (AEHS) 25th Annual International Conference on Soil, Sediment, Water & Energy San Diego, California by Robin V. Davis, P.G. Project Manager Utah Department of Environmental Quality Leaking Underground Storage Tanks rvdavis@utah.gov 801-536-4177
OBJECTIVES • Understand why petroleum vapor intrusion (PVI) is very rare despite so many petroleum LUST sites • Understand causes of PVI • Show mechanisms, characteristics, degree of vapor bioattenuation • Show distances of vapor attenuation, apply as Screening Criteria, screen out low-risk sites • Avoid unnecessary additional investigation, soil gas/air sampling
SCOPE • Field studies published by work groups, individuals • Data compiled to an empirical database: EPA Petroleum Vapor Database Jan. 2013 • Source strength: LNAPL in soil and GW, dissolved-phase • Associated soil gas measurements from 1000s of sample points at 100s of sites • Extensive peer review and quality control checks • Guidance Documents Issued: • Some US States • Australia 2012 • EPA draft PVI April 2013 • ITRC October 2014 • EPA ORD Issue Paper 2014
Petroleum Vapor Database of Empirical Studies EPA OUST Jan. 2013 Canada 4/13 United States 70/816 Australian sites evaluated separately MAP KEY REFERENCES Australia 70 # geographic locations evaluated Davis, R.V., 2009-2011 McHugh et al, 2010 Peargin and Kolhatkar, 2011 Wright, J., 2011, 2012, Australian data Lahvis et al, 2013 EPA Jan 2013, 510-R-13-001 124/>1000 # paired concurrent measurements of subsurface benzene soil vapor & source strength 816 Perth Sydney Tasmania
Conceptual Characteristics of Petroleum Vapor Transport and Biodegradation KEY POINTS • Aerobic biodegradation of vapors is rapid, occurs over short distances • LNAPL sources have high mass flux, vapors attenuate in longer distances than dissolved sources • Sufficient oxygen supply relative to its demand, function of source strength 0 1 O2/Hydrocarbon Vapor Profile 0 1 O2/Hydrocarbon Vapor Profile After Lahvis et al 2013 GWMR
Subsurface Petroleum Vapor Bioattenuation Study Results • >100 years of research proves rapid vapor biodegradation by 1000s of indigenous microbes • Studies show vapors biodegrade and attenuate within a few feet of sources • No cases of PVI from low-strength sources • Causes of PVI are well-known
2 4 1 3 Groundwater-Bearing Unit Causes of Petroleum Vapor Intrusion Preferential pathway: bad connections of utility lines; natural fractured and karstic rocks BUILDING High-strength source in direct contact with building (LNAPL, high dissolved, adsorbed) Unsaturated Soil LNAPL LNAPL High-strength source in close proximity to building, within GW fluctuation zone Affected GW Preferential pathway: sumps, elevator shafts LNAPL Drawing after Todd Ririe, 2009 High-Strength Sources • Direct contact or close proximity to buildings • Preferential pathways: engineered & natural
Collect Basic Data, Characterize Site, Construct Conceptual Site Model • Define extent & degree of contamination • Apply Screening Criteria Building Soil Boring/MW Soil Boring/MW Utility line LNAPL in soil Clean Soil UST system High vapor concentrations, high mass flux from LNAPL & soil sources Low vapor concentrations, low mass flux from dissolved sources LNAPL in soil & GW Dissolved contamination
Signature Characteristics of Aerobic Biodegradation of Subsurface Petroleum Vapors LNAPL • Vapors aerobically biodegraded by oxygen-consuming microbes, waste product carbon dioxide • Vapors attenuate in short distances
Vapor Bioattenuation Limited by Contaminated Soil LNAPL in Soil (sand, silty sand)
Importance of Shallow Vapor Completion Points Example of apparent non-attenuation until shallow vapor point installed in non-contaminated soil VW-11 Hal’s, Green River, Utah 6/27/07 8/26/06 Shallow completion too deep Shallower point confirms attenuation above contaminated soil zone No attenuation within contaminated soil zone
EPA OUST Jan. 2013 Results of Empirical Studies http://www.epa.gov/oust/cat/pvi/PVI_Database_Report.pdf • Thickness of clean soil required to attenuate vapors associated with LNAPL and dissolved sources • Screening Criteria
Dissolved Sources 4.94 feet Benzene in GW 12,000 ug/L 4 feet Benzene in GW 3180/ ug/L Thickness of clean soil needed to attenuate vapors = Distance between top of source and deepest clean vapor point
LNAPL Sources 8 feet Thickness of clean soil needed to attenuate vapors = Distance between top of LNAPL and deepest clean vapor point
Screening Distances Dissolved Sources Benzene Vapors vs. Distance of Attenuation LNAPL Sources (small sites) Benzene Vapors vs. Distance of Attenuation 5 ft 15 ft 95%-100% Confidence
Lahvis et al 2013 Results of Vapor Attenuation from LNAPL Sources • Different analysis, similar results • 13 ft vertical separation attenuates LNAPL source vapors 13 feet, 95% Confidence
LNAPL Indicators (after EPA 2013; Lahvis et al 2013)
Results of Empirical Studies for Developing Screening Criteria • Various methods of data analysis yield similar results • Dissolved Sources require 5 feet separation distance: • Benzene <5 mg/L • TPH <30mg/L • LNAPL Sources require 15 feet separation distance: • Benzene >5 mg/L, >10 mg/kg • TPH >30mg/L, >250-500 mg/kg • 18 feet separation required for large industrial sites • Soil within separation distance: • LNAPL-free soil contains sufficient oxygen to bioattenuate vapors • “Clean” (non-source), biologically active, sufficient oxygen and moisture • EPA: <100 mg/kg TPH “clean” soil
Measuring Magnitude of Subsurface Vapor Attenuation Subsurface Attenuation Factor (AF) = Ratio of shallow to deep vapor concentration Shallow SV Benzene, ug/m3 AF = Deep SV Benzene, ug/m3 Field Example: ~1 ug/m3 AF = 7E-06 = 145,000 ug/m3 ~7,000,000x contaminant reduction
Distribution of Magnitude of Subsurface Petroleum Vapor Attenuation Factors 3 Reasons for Insignificant AFs 10x-100x Most events exhibit Significant AFs >10,000x Screen these out Reasonable Screening AF 100x-1000x
EPA Modeling Studies Vertical and Lateral Attenuation Distances http://www.epa.gov/oswer/vaporintrusion/documents/vi-cms-v11final-2-24-2012.pdf
Building with Basement LNAPL Vapor Source 200,000,000 ug/m3 8 m deep (26 ft) 0 Model: 20 ft vertical 16 ft lateral Field Data: 15 ft vertical 8 ft lateral Conclusions: - Models under-predict attenuation - Vapors attenuate in shorter distances laterally than vertically 2 Vertical Attenuation 6m (20 ft) 4 Lateral Attenuation 5m (16 ft) 6 8 10 20 30 40 50 60 70 80 90 Vertical Distance Below Grade, meters Oxygen 0 2 4 6 8 Lateral Distance, meters
Screening Criteria U.S. and Australia