Download
1 / 12
120 likes | 259 Views
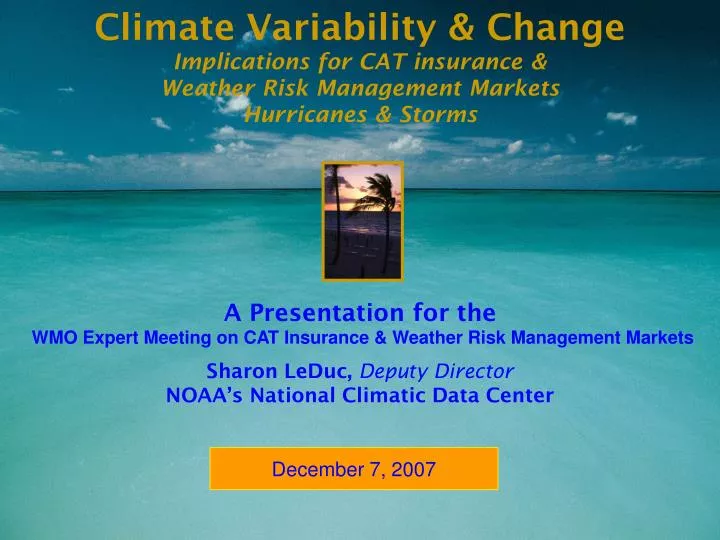
Climate Variability & Change Implications for CAT insurance & Weather Risk Management Markets Hurricanes & Storms. A Presentation for the WMO Expert Meeting on CAT Insurance & Weather Risk Management Markets Sharon LeDuc, Deputy Director NOAA’s National Climatic Data Center.

E N D
Climate Variability & Change Implications for CAT insurance & Weather Risk Management Markets Hurricanes & Storms A Presentation for theWMO Expert Meeting on CAT Insurance & Weather Risk Management Markets Sharon LeDuc, Deputy Director NOAA’s National Climatic Data Center December 7, 2007
Storms: Hurricanes - Observed • Increases in extreme wave heights along the East Coast are evident during the hurricane season • Increasing hurricane intensity is • likely a contributing factor in • this increase 2
Storms: Hurricanes - Projections • For North Atlantic and North Pacific hurricanes: • For every degree Celsius of tropical SST increase, the surface wind speeds of the strongest hurricanes will increase 2-10%
Storms: Hurricanes - Projections • For North Atlantic and North Pacific hurricanes: • For every degree Celsius of tropical SST increase, core rainfall rates will increase 6-18%
Storms: Hurricanes - Projections • N. Atlantic and N. Pacific hurricanes • Frequency changes are too uncertain for confident projections • Wind shear and SSTs play opposing roles • Spatial distribution of hurricanes will likely change
Storms: Non-tropical - Observed • It is very likely that there • has been a northward shift • in the tracks of strong • storms in N. Pacific and • N. Atlantic over the past • 50 years • In the North Pacific, the strongest storms are becoming even stronger • Data are insufficient to draw conclusions about changes in storm strength in the N. Atlantic
Storms: Non-tropical - Projections • Human influences on changes in sea-level pressure are evident in the NH - affects the location and intensity of storms • In the future, strong non-tropical storms are likely to be: • more frequent • withstronger winds • and moreextreme wave • heights
Precipitation Extremes Extreme precipitation episodes (heavy downpours) became more frequent and intense in recent decades over most of North America • Intense precipitation (heaviest 1%) increased 20% over the past century - total precipitation increased by 7% • Overall, precipitation will likely be less frequent but more intense • 1-in-20 yr precipitation - projected to occur 1-in-8 years by 2100 over much of eastern N. America • (mid-range emission scenario) 8
Drought likely that increasing temperatures (& associated increasing evaporation potential) already contribute to droughts making them longer & more intense • No trend in North American droughts in the last century • But regional tendencies toward more severe droughts (southwestern U.S., parts of Canada, Alaska, Mexico) • Droughts projected to become more severe in many locations (due to higher temperature & evaporation potential & more sporadic rainfall) 9
Storms: Hurricanes - Data • Adjustments are necessary to account for missing storms • Sparser and less reliable observations earlier in 20th century • For the Atlantic: • Data reliable back to 1945 • Prior to 1900, data are too unreliable to draw definitive conclusions • Estimates of intensity, less reliable than frequency in historical record: • Major hurricanes increased in intensity in the 1940s • Observations improve with aircraft reconnaissance 10
Storms: Hurricanes - Observed • Frequency of Atlantic tropical storms, hurricanes & major hurricanes increased: • substantial since 1970 • likely substantial since 1950 • less confidence in data prior to 1900 • No evidence of trend in U.S. landfalling hurricanes
Storms: Hurricanes - Observed balance of evidence suggests human activity has caused a discernable increase in hurricane frequency in the N. Atlantic • The increase in Atlantic hurricane frequency is associated with increasing sea surface temperatures (SSTs) in the hurricane formation region • Human activities have had a discernable impact on SSTs in the hurricane formation region • Hurricane destructive potential has increased since 1970, also in association with warmer SSTs 12