Download
1 / 1
10 likes | 101 Views
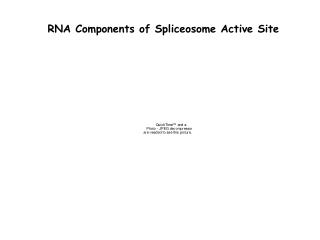
The 0.93 Å 2fo-fc electron density map (yellow) for the active site region of TM1010 superipmosed on the atomic coordinates. Data were collected at the APS GM/CAT 23-ID-D at a wavelength of 0.8856 Å and to a resolution of 0.9 Å

E N D
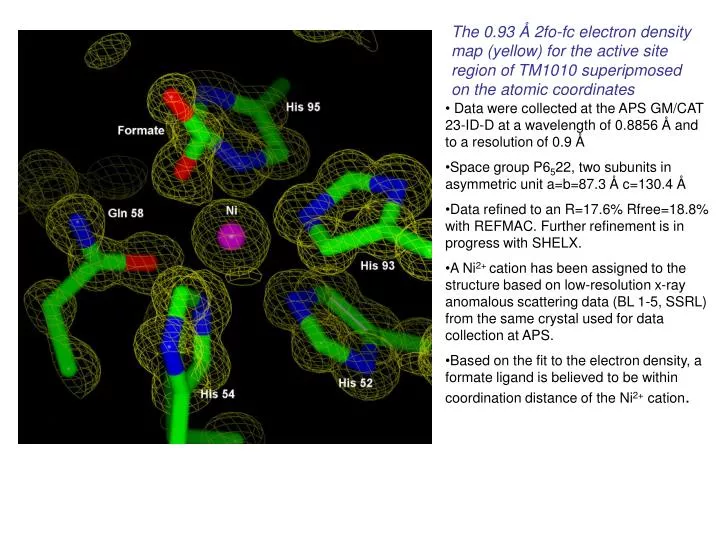
The 0.93 Å 2fo-fc electron density map (yellow) for the active site region of TM1010 superipmosed on the atomic coordinates • Data were collected at the APS GM/CAT 23-ID-D at a wavelength of 0.8856 Å and to a resolution of 0.9 Å • Space group P6522, two subunits in asymmetric unit a=b=87.3 Å c=130.4 Å • Data refined to an R=17.6% Rfree=18.8% with REFMAC. Further refinement is in progress with SHELX. • A Ni2+ cation has been assigned to the structure based on low-resolution x-ray anomalous scattering data (BL 1-5, SSRL) from the same crystal used for data collection at APS. • Based on the fit to the electron density, a formate ligand is believed to be within coordination distance of the Ni2+ cation.