Download
1 / 15
150 likes | 253 Views
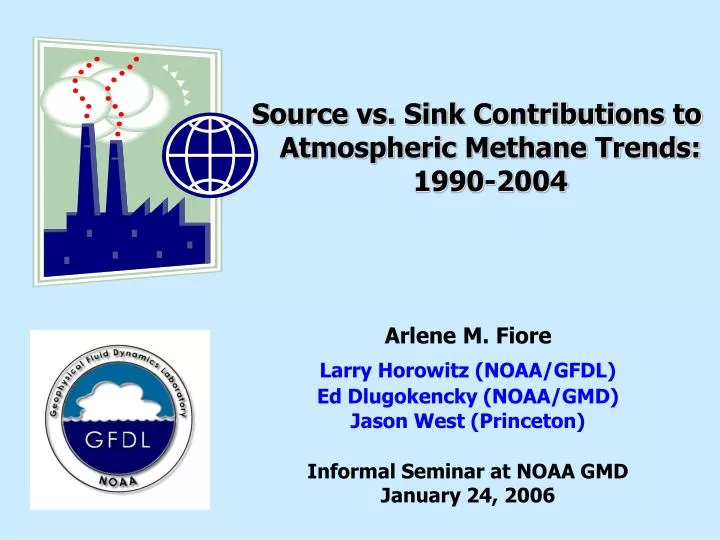
Source vs. Sink Contributions to Atmospheric Methane Trends: 1990-2004. Arlene M. Fiore Larry Horowitz (NOAA/GFDL) Ed Dlugokencky (NOAA/GMD) Jason West (Princeton) Informal Seminar at NOAA GMD January 24, 2006. More than half of global methane emissions are influenced by human activities

E N D
Source vs. Sink Contributions to Atmospheric Methane Trends: 1990-2004 Arlene M. Fiore Larry Horowitz (NOAA/GFDL) Ed Dlugokencky (NOAA/GMD) Jason West (Princeton) Informal Seminar at NOAA GMD January 24, 2006
More than half of global methane emissions are influenced by human activities ~300 Tg CH4 yr-1 Anthropogenic [EDGAR 3.2 Fast-Track 2000; Olivier et al., 2005] ~200 Tg CH4 yr-1 Biogenic sources [Wang et al., 2004] BIOMASS BURNING + BIOFUEL 30 ANIMALS 90 WETLANDS 180 LANDFILLS + WASTEWATER 50 GLOBAL METHANE SOURCES (Tg CH4 yr-1) GAS + OIL 60 COAL 30 TERMITES 20 RICE 40
Observed trend in Surface CH4 (ppb) 1990-2004 Global Mean CH4 (ppb) • Hypotheses for leveling off • discussed in the literature: • 1. Approach to steady-state • 2. Source Changes • Anthropogenic • Wetlands • Biomass burning • 3. Transport • 4. Sink (OH) • Humidity • Temperature • OH precursor emissions • overhead O3 columns GMD Network Data from 42 GMD stations with 8-yr minimum record is area-weighted, after averaging in bands 60-90N, 30-60N, 0-30N, 0-30S, 30-90S How does a 3-D forward model compare with GMD observations?
Global Mean Surface Methane (ppb) Captures flattening post-1998 but underestimates abundance Emissions problem? OBSERVED Model with constant emissions largely captures observed trend in CH4 during the 1990s MOZART-2 [Horowitz et al., 2003] • NCEP • 1.9°x1.9° • 28 s-levels • EDGAR v.2.0 emissions • CH4 EDGAR emissions for 1990s
Bias and Correlation vs. GMD Surface CH4: 1990-2004 r2 Mean Bias (ppb) BASE BASE simulation with constant emissions: • Overestimates interhemispheric gradient • Correlates poorly at high northern latitudes
Inter-annually varying wetland emissions 1990-1998 from Wang et al. [2004] (Tg CH4 yr-1); distribution changes Apply climatological mean (224 Tg yr-1) post-1998 ANTH ANTH + BIO Estimates for Changing Methane Sources in the 1990s Biogenic adjusted to maintain constant total source 547 Tg CH4 yr-1 BASE EDGAR anthropogenic inventory
Bias & Correlation vs. GMD CH4 observations: 1990-2004 Mean Bias (ppb) OBS BASE ANTH ANTHsimulation with time-varying EDGAR 3.2 emissions: Improves abundance post-1998 • Interhemispheric gradient too high • Poor correlation at high N latitudes r2
Bias & Correlation vs. GMD CH4 observations: 1990-2004 Mean Bias (ppb) OBS BASE ANTH ANTH+BIO ANTH+BIOsimulation with time-varying EDGAR 3.2 + wetland emissions improves: Global mean surface conc. Interhemispheric gradient • Correlation at high N latitudes r2 S Latitude N
Model with BIO wetlands improves: 1)high N latitude seasonal cycle 1900 1850 1800 Alert (82.4N,62.5W) 1840 1820 1800 1780 1760 1740 2)trend Midway (28.2N,177.4W) 3)low bias at S Pole, especially post-1998 1800 1750 1700 Mahe Island (4.7S,55.2E) 1740 1720 1700 1680 1660 1640 South Pole (89.9S,24.8W) 1995 2000 2005 1990 OBS (GMD) BASE ANTH ANTH+BIO Methane Concentration (nmol/mol = ppb) Model captures distinct seasonal cycles at GMD stations
Time-Varying Emissions: Summary Annual mean CH4 in the “time-varying ANTH+BIO” simulation best captures observed distribution OBS BASE ANTH ANTH+BIO Next: Focus on Sinks -- Examine with BASE model (constant emissions) -- Recycle NCEP winds from 2004 “steady-state”
Methane rises again when 1990-1997 winds are applied to “steady-state” 2004 concentrations Area-weighted global mean CH4 concentrations in BASE simulation (constant emissions) Recycled NCEP 1990-2004 • Meteorological drivers for observed trend • Not just simple approach to steady-state
CH4 Lifetime against Tropospheric OH Rapid transport to sink regions Candidate Processes: t = Humidity Lightning NOx Photolysis Recycled NCEP Temperature How does meteorology affect the CH4 lifetime? Lifetime Correlates Strongly With Lower Tropospheric OH and Temperature r2 = 0.89 vs. OH if 1998 neglected (0.80 for Temp) r2 = 0.51 r2 = 0.83 105 molecules cm-3
Deconstruct Dt (-0.17 years) from 1991-1995 to 2000-2004 into individual contributions by varying OH and temperature separately + = DT(+0.3K) BASE DOH(+1.4%) • OH increases in the model by 1.4% due to a 0.3 Tg N yr-1 increase in lightning NOx emissions • Large uncertainties in magnitude (and trend) of lightning NOx emissions in the real atmosphere
Potential for strong climate feedbacks Methane Distribution and Trends: Conclusions Global Mean CH4 (ppb) BASE (constant emissions) captures observed rate of increase 1990-1997 and leveling off post-1998 ANTH improves modeled CH4 post-1998 Wetland emissions in ANTH+BIO best match observed seasonality, inter-hemispheric gradient and global trend OBSERVED tCH4 decreases by ~2% from 1991-1995 to 2000-2004 due to warmer temperatures (35%) and higher OH (65%), resulting from a 10% increase in lightning NOx emissions
Higher in a warmer climate? Q: How will future global change influence atmospheric CH4?Potential for complex biosphere-atmosphere interactions…can be studied with GFDL earth system model CH4 + OH …products BVOC NOx Soil