Download
1 / 20
200 likes | 291 Views
Presenter: K-S Kuo. IN42A-08 Automated Tracking of Tornado-Producing Mesoscale Convective Systems in the United States. Authors. K.-S. Kuo 1,2,3 T. L. Clune 4 Y. Hong 5 S. M. Freeman 4,6 C. A. Cruz 4,6 J. Kouatchou 4,7 R. W. Burns 4,6. Affiliations

E N D
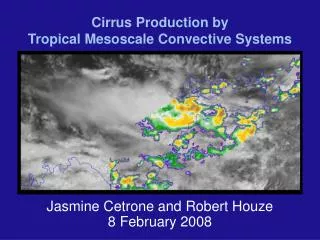
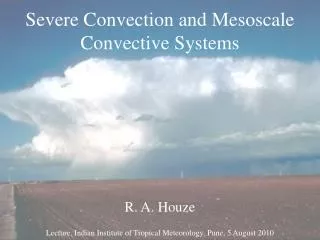
Presenter: K-S Kuo IN42A-08Automated Tracking of Tornado-Producing Mesoscale Convective Systems in the United States
AGU 2011 Fall Meeting, San Francisco, CA Authors K.-S. Kuo1,2,3 T. L. Clune4 Y. Hong5 S. M. Freeman4,6 C. A. Cruz4,6 J. Kouatchou4,7 R. W. Burns4,6 Affiliations • Mesoscale Atmospheric Processes Laboratory NASA Goddard Space Flight Center • Goddard Earth Science Technology and Research (GESTAR) Cooperative Program • Caelum Research Corporation • Software Systems Support OfficeNASA Goddard Space Flight Center • Department of Civil EngineeringUniversity of Oklahoma • Northrop Grumman Information Systems • Tetra Tech AMT Acknowledgement: NASA Earth Science Technology Office (ESTO)
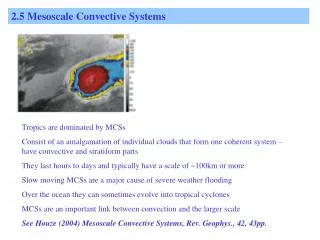
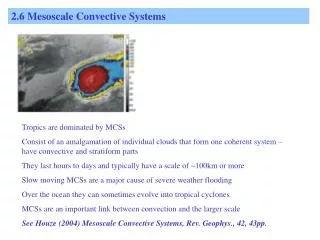
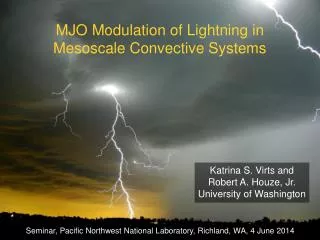
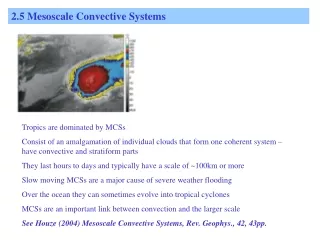
A moving-object database, MODB, is a database with spatiotemporal capabilities, which are often extensions to stock relational database management systems. An Earth Science (ES) event is an episode of a geophysical phenomenon, such as a hurricane, a tornado, or a thunderstorm shower. A mesoscale convective system, MCS, is an organized ensemble of convective elements, whose lifecycle is longer than that of the individual convective elements. AGU 2011 Fall Meeting, San Francisco, CA Definitions
Earth Science MODBs facilitate easier discoveries of relevant data associated with ES phenomena and enable systematic studies of these phenomena. • Populating the databases, however, is currently largely manual and time-/labor-intensive. • Motivation: Automatic population of MODBs with Earth Science events. • Using MCS as an example, we have developed a system to automatically • Identify and track tornado-producing MCSs using • surface precipitation rate (R)and • thermal infrared brightness temperature (TB) • Extract MCS spatiotemporal parameters for populating MODB • Obtain MCS morphological parameters to enhance MODB capabilities AGU 2011 Fall Meeting, San Francisco, CA Introduction (1/2)
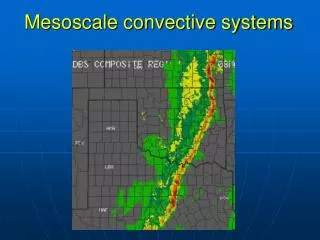
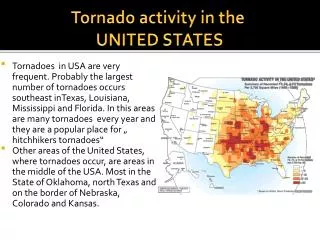
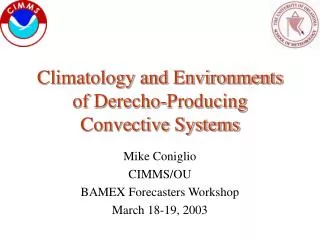
We use tornado-producing MCSs to demonstrate the capabilities of the system. The system is easily configurable to apply to other phenomena. • Why Mesoscale Convective System (MCS)? • MCSsproduce a broad range of severe convective weather events. • MCSs account for about half of the annual warm-season rainfall over the Great Plains. • Understanding MCSs will improve weather prediction models and other tools to protect populations and their properties. AGU 2011 Fall Meeting, San Francisco, CA Introduction (2/2)
Portability Extensibility Customizability Configurability Usability Testability Reliability … AGU 2011 Fall Meeting, San Francisco, CA Design PrinciplesLots of -abilities
AGU 2011 Fall Meeting, San Francisco, CA Implementation (1/4)Process Flow Go though each time step and determine event track Identify event component data points, e.g.TB < 240 K Driver loads required modules based on a configuration file and initiates the process. Identify event component with criteria, such as minimum area coverage required Filter event tracks based on additional criteria, e.g. tracks containing tornado(s)
Test-Driven Development (TDD) method • Java-based for cross-platform compatibility • Multi-threaded parallelization • Controllable with simple configuration files • Pluggable components for customization • Identifiers • Apply grid-cell/pixel level identification criteria (e.g. TB and/or precip. thresholds) • Specify identification criteria at the component level (area, position, etc.) • Trackers • Determine event component relationships to establish event tracks • Track Identifiers • Specify event track identification criteria (e.g. only include tornadic events, only include events from specific time or place, etc.) • Serializers • Customize output generation AGU 2011 Fall Meeting, San Francisco, CA Implementation (2/4)
Use Connected Component Labeling (CCL) algorithm for event identification • Accept script-based component modules • Allows for experimentation without recompiling the system code. • Flexibility and customization • Groovy now, Jythonplanned • Object database (DB4O Java API) • Stores events as objects • Allows for object-based queries using complex criterion (such as spatial/temporal queries) • Queries are programmable/scriptable • Groovy now, Jythonplanned • Previous results can be used as input for further refinement • Example: A more stringent new threshold of TB <235 K may be applied to previous results obtained using TB < 240 K without going through the voluminous input data again. • “Previous results” can be either in files or from database AGU 2011 Fall Meeting, San Francisco, CA Implementation (3/4)
AGU 2011 Fall Meeting, San Francisco, CA Implementation (4/4)Example Configuration File #Basic settings [General Tracker Configuration] #Specifies the "name" of the run. scenario.name = GOES Test #Specifies a description of the run. (optional) scenario.description = Test scenario for finding events within GOES IR data. #Specifies the identifier class to use for event identification. identifier.class = nasa.goes.GOESMCSTornadicEventIdentifier #Specifies the tracker class to use to track events. tracker.class = nasa.tracker.ccl.trackers.CCLEventTracker2DST #Specifies the serializer class to use for outputting event tracks. (optional) serializer.class = nasa.goes.GOESEventImageSerializer #Output location for output generation. This is a top level property that can be overridden by implementation specific properties. output = output/test #Enables overwriting. When set to true, the event tracker will overwrite an existing file/DB entry with the same nameoverwrite = true#Database Configuration …
NMQ – National Mosaic & Multi-Sensor QPE • NMQ Q2: Surface rain rate, 1-km spatial, 5-min temporal • Continuous coverage in time • http://www.nssl.noaa.gov/projects/q2/ • Geostationary Operational Environmental Satellite (GOES) Imager • Rapid Scan Operations (RSO) • 10.8 μm Brightness Temperature, 4-km spatial, irregular (~15-min) temporal • Episodic coverage in time; data dropouts • http://www.class.noaa.gov • Archived NWS Warnings/Watches Database • GIS shapefiledata • http://mesonet.agron.iastate.edu/request/gis/watchwarn.phtml • Tornado History Porject • CSV data, tornado geo-locations, no time information except for initiation • http://www.tornadohistoryproject.com AGU 2011 Fall Meeting, San Francisco, CA Data
AGU 2011 Fall Meeting, San Francisco, CA VisualizationGOES TB (10 May 2010 14:40 UTC) Brightness Temperature (10.8 μm)
AGU 2011 Fall Meeting, San Francisco, CA AllEvents GOESTB< 240K NMQ Q2 R > 0 mm/hr
AGU 2011 Fall Meeting, San Francisco, CA VisualizationRegional Precipitation – NMQ Q2
AGU 2011 Fall Meeting, San Francisco, CA TornadicEvents GOESTB< 240K NMQ Q2 R > 0 mm/hr
AGU 2011 Fall Meeting, San Francisco, CA Event QueryExample GOES Results
Prototype of a flexible system for tracking ES events. Initial success of applying the system to tornado-producing MCSs. An example of a new class of tools for data-intensive science. AGU 2011 Fall Meeting, San Francisco, CA Conclusions
AGU 2011 Fall Meeting, San Francisco, CA Thank you!
GOES imager infrared (10.8 μm) radiance data were converted to brightness temperatures. We used CDO tools to re-grid the data from a non-uniform satellite grid domain into a uniform grid encompassing the continental US. The 2D NMQ data, provided as 8-tile CONUS files were stitched into CONUS non-tile data, using a java tool developed in-house. AGU 2011 Fall Meeting, San Francisco, CA Pre-Processing
NMQ – National Mosaic & Multi-Sensor Quantitative Precipitation Estimate (QPE) • NMQ Q2: Surface rain rate, 1 km spatial, 5-min temporal • http://www.nssl.noaa.gov/projects/q2/ • Used the lowest altitude radar bins with valid reflectivity values to derive 2D rain rates. • Estimate precipitation derived by using satellite, lightning detection, radar networks, upper air and surface observations, and models. • 3D radar mosaic grid with a 1-km horizontal resolution over 31 vertical levels and a 5-minute update cycle. • Produced by taking base level data from all available radars (NEXRAD, Canadian Radar, TDWR, gap radars) at any given time, performs quality control, and then combines reflectivity observations from individual radars onto a unified 3D Cartesian frame. • The 3D reflectivity grid can be used for multi-sensor severe storm algorithms, regional rainfall products generation, etc. • GOES Imager 10.8-mm Brightness Temperature – NOAA CLASS • Geostationary Operational Environmental Satellite (GOES) Rapid Scan Operations (RSO) • 4-km spatial resolution, irregular time intervals (nominally every 15 minutes) • NWS Warnings: GIS shapefile data • Allow users to display and use potentially life-saving and property damage reduction information from the NWS in a more efficient and user-friendly manner. • Allow to view weather information with much greater detail. • TornadoHistory: CSV data • The Tornado History Project maintains a database of all tornadoes that have occurred in the United States since 1950. • Records the starting date, starting time (but no end time), the path (in terms of states and counties traversed by the tornado), the width, the length, the touchdown/liftoff coordinates, etc. • Data come from the Storm Prediction Center's (SPC) historical tornado data file, and from from theNational Climatic Data Center (NCDC). AGU 2011 Fall Meeting, San Francisco, CA Data