Download
1 / 22
240 likes | 554 Views
Visual Analytics Utilizing Tableau Interactive Dashboards. Michael Le, Humboldt State University Dmitri Rogulkin , Fresno State University. Overview. Agenda Dashboards/ FERPA / IRB Dashboard Best Practice Using Tableau Public Using Tableau Server

E N D
Visual Analytics Utilizing Tableau Interactive Dashboards Michael Le, Humboldt State University Dmitri Rogulkin, Fresno State University
Overview Agenda • Dashboards/FERPA/ IRB • Dashboard Best Practice • Using Tableau Public • Using Tableau Server • Demonstrate Visual Analytics Dashboards • Question and Answer
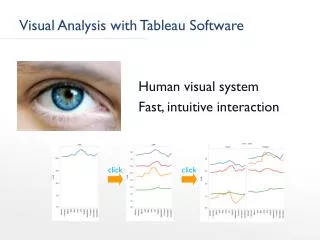
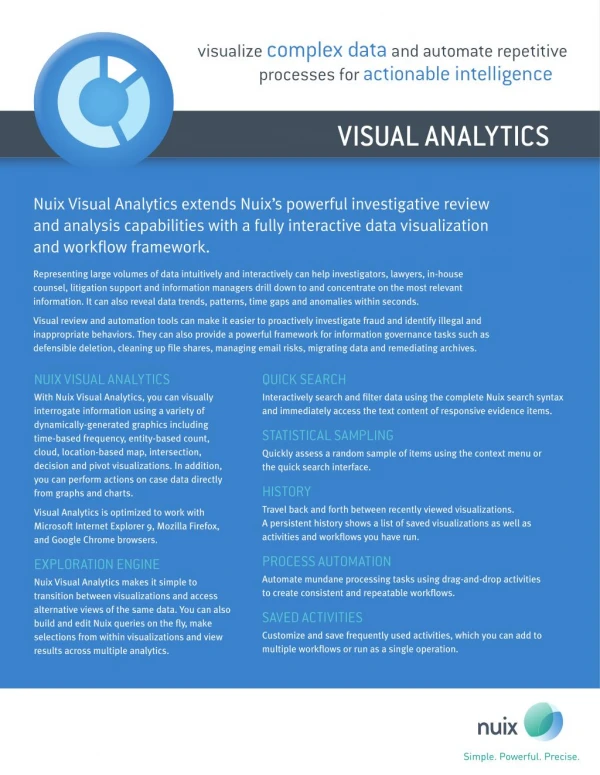
Dashboards/FERPA/ IRB Buzz Words • Dashboards… • Presents information in a way that is easy to read and interpret • Key Performance Indicator… • Success or steps leading to the success of a goal • Visual Analytics… • Examine data visually for patterns, trends, or differences between groups
Dashboards/FERPA/ IRB Solutions • Public Facing Dashboards • Limit drill down capability • Login Required Dashboards • Limit access to the dashboard
Dashboard Best Practice Steps for creating Dashboards • Choose metrics that matter • Keep it visual • Make it interactive • Keep it current or don’t bother • Make it simple to access and use
Dashboard Best Practice Institutional Dashboards: Navigational Tool for Colleges and Universities Number 123, Winter 2012
Dashboard Best Practice Indicator Group Usage Ranking by Category
Dashboard Best Practice Steps for Creating Dashboards • Select a metric • Visual presentation • Design • Refine • Publish
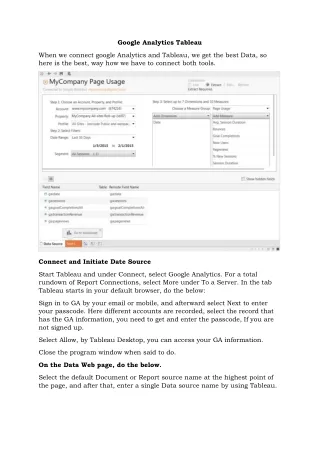
Using Tableau Public Tableau Public • Free to use • 1 GB of storage • Easy to embed in webpage Tableau Public Premium • Price based on page views
Using Tableau Public HSU IR Webpage • Navigation • Video Tutorial • Printing
Using Tableau Server(Fresno State) PeopleSoft Tableau Server (WWW) Tableau Professional SQL Server ERS Data Other Data
Using Tableau ServerKey Audience Program Coordinators Deans Collaborate, Learn, Engage, Solve Problems Advisors Chairs Senior Management Committees & Task Forces
Question and Answer Dmitri Rogulkin Fresno State University drogulkin@csufresno.edu Presentation Posted at: www.humboldt.edu/irp/presentations.html Michael Le Humboldt State University Michael.Le@humboldt.edu