Download
1 / 20
200 likes | 343 Views
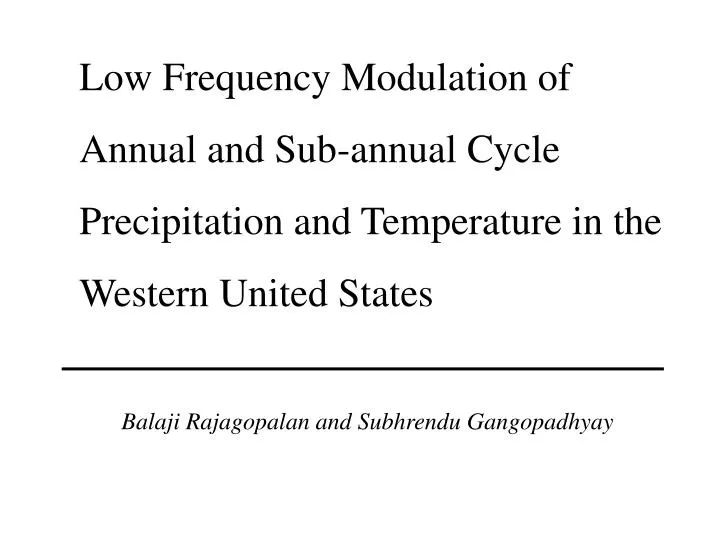
Low Frequency Modulation of Annual and Sub-annual Cycle Precipitation and Temperature in the Western United States. Balaji Rajagopalan and Subhrendu Gangopadhyay. Objective. How does the low frequency components of the climate system ( e.g., ENSO, PDO, etc.) modulate high

E N D
Low Frequency Modulation of Annual and Sub-annual Cycle Precipitation and Temperature in the Western United States Balaji Rajagopalan and Subhrendu Gangopadhyay
Objective How does the low frequency components of the climate system (e.g., ENSO, PDO, etc.) modulate high frequency components of the climate system, namely, regional annual and sub-annual cycles of precipitation and temperature. Study Area : Western United States
WA MT OR ID WY NV UT CO CA AZ NM Study Area and Data • 11 states (AZ, CA, CO, ID, MT, NV, NM , OR, UT, WA, WY) • total, 84 climate divisions • 106 years (1895-2000) of monthly precipitation and • temperature data for each climate division
Methodology • Uses the technique MTM-SVD (multi-taper method using singular- • value decomposition). • Identify significant frequencies from the MTM spectrum. • Do space-time reconstruction at these significant frequencies. • Use the space-time reconstructions to analyze temporal evolution • of these significant frequencies, and phase shifts. • Finally, use spectral-coherence to relate low frequency components • with precipitation and temperature at the annual and sub-annual • frequencies.
MTM Spectrum – Joint Precip. and Temp. • Low Frequency • 0.0 to 0.5 cycles/yr • High Frequency • 0.5 to 6.0 cycles/yr
MTM Spectrum – Only Precipitation • Significant frequencies (cy/yr) at 95% confidence level • 0.0674 • 0.1875 (~ 5 yr cycle) • 0.3721 (~ 3 yr cycle) • 1.0000 (annual cycle) • 2.0000 (sub-annual cycle) • other harmonics
Temporal Evolution of Frequencies – Joint P-T Moving Window MTM-SVD at 90% Observations:- - ENSO and decadal oscillations are patchy - enhanced ENSO post 1980 - annual and sub-annual cycles significant all throughout
Spatial Reconstruction at Significant Frequencies – LOW Frequencies, P and T
Spatial Reconstruction at Significant Frequencies – HIGH Frequencies, P and T
Spatial Reconstruction of ANNUAL Cycle Using a 20-year Moving Window – Precipitation
Spatial Reconstruction of ANNUAL Cycle Using a 20-year Moving Window – Temperature
Phase Shift of ANNUAL Cycle P and T 1950-1975; 1975-2000
Phase Shift of SUB-ANNUAL Cycle P and T 1950-1975; 1975-2000
Diagnosis of Space-time Reconstructions and Phase Shifts • For precipitation, Pacific Northwest and Arizona are out of phase • ( we know that these two regions have the opposing ENSO signal • for winter precipitation), the shifts are of the order of +/- 50 days • (positive is early and negative is late). • With temperature, all the shifts in temperature are positive and in • the mid-latitudes this implies for example an early Spring. Such • shift in temperature for example in the Pacific Northwest we can • expect that winter precipitation comes more as rain-on-snow type • events.
Diagnosis of Space-time Reconstructions and Phase Shifts • Also in case of precipitation, there are very little shifts in the rest • of the study region. • Wherever the annual cycle is weak, primarily in the desert regions • (in particular, California-Nevada border, southern Utah, western • Montana) there seems to be a shift in the annual cycle close to 100 • days. This apparently is a very large shift but to some extent makes • sense because these are desert regions; alittle precipitation goes a • long way to show significant shifts.
Diagnosis of Space-time Reconstructions and Phase Shifts • With the 6-month cycle, we observe that for precipitation, • the shifts are nearly halved and for temperature the shifts • are nearly double that of the annual cycle.
Spectral Coherence Next plots :- Spectral coherence between January through April SST (sea surface temperature) first principal components (refereed in the figures as PC1B1; PC1B2 and PC1B3 are the extra-tropic SST PCs) and spatially averaged MTM projections time-reconstructed for both the annual and sub-annual cycles
Low Frequency Modulation of Annual and Sub-annual Cycle Precipitation and Temperature in the Western United States Balaji Rajagopalan and Subhrendu Gangopadhyay