Download

1 / 53
530 likes | 621 Views
ACHIEVEMENT IN AMERICA: Where Are We? What Can We Do?. Austin, TX January, 2013. Back in 1983, we had a bit of a wake up call as a nation. Almost every state stepped up to respond. First step: increased high school course requirements.

E N D
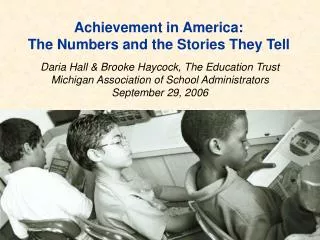
ACHIEVEMENT IN AMERICA: Where Are We? What Can We Do? Austin, TX January, 2013
First step: increased high school course requirements. But though course completions soared, student learning outcomes didn’t.
Next step: Set standards, adopt assessments and hold schools accountable.
Texas stepped into lead. During 1990’s, TX and NC were lauded nationally as the “biggest gainers” on national exams.
And the innovation that started here—holding schools responsible for the performance of every group of students—was considered so promising that it became the core of federal policy.
NAEP LTT 4th Grade Reading:Record Performance with Gap Narrowing *Denotes previous assessment format NAEP 2008 Trends in Academic Progress, NCES
NAEP LTT 4th Grade Math:Record Performance with Gap Narrowing *Denotes previous assessment format NAEP 2008 Trends in Academic Progress, NCES
Main NAEP: Improvement and some gap-closing over last decade *Accommodations not permitted NAEP Data Explorer, NCES (Proficient Scale Score = 238)
Main NAEP: All groups have improved since 1990, some gap closing *Accommodations not permitted NAEP Data Explorer, NCES (Proficient Scale Score = 249)
Main NAEP: Some gap closing over the last decade *Accommodations not permitted NAEP Data Explorer, NCES (Proficient Scale Score = 281)
Main NAEP: Over the last decade, all groups have steadily improved and gaps have narrowed *Accommodations not permitted NAEP Data Explorer, NCES (Proficient Scale Score = 299)
Perhaps because it got started earlier—and because it held schools accountable for the progress of every group of students--record in Texas:Better than most.
Overall, Texas’s students outperform the nation in math Texas NAEP Data Explorer, NCES (Proficient Scale Score = 299)
Latino students in Texas outperform counterparts in most other states in math Texas NAEP Data Explorer, NCES (Proficient Scale Score = 299)
African-American Students in Texas among highest performing in country. Texas NAEP Data Explorer, NCES (Proficient Scale Score = 299)
White students in Texas among the highest-scoring nationwide Texas NAEP Data Explorer, NCES (Proficient Scale Score = 299)
Low-income Texas students outperform those in all other states in math Texas NAEP Data Explorer, NCES (Proficient Scale Score = 299)
Higher income students in Texas perform above those in most other states Texas NAEP Data Explorer, NCES (Proficient Scale Score = 299)
While, overall, Texas students slightly below national average in reading Texas NAEP Data Explorer, NCES (Proficient Scale Score = 238)
Texas’s white students outperform the national average Texas NAEP Data Explorer, NCES (Proficient Scale Score = 238)
Texas’s Latino students have higher reading scores than their counterparts in most states Texas NAEP Data Explorer, NCES (Proficient Scale Score = 238)
African-American Students in Texas outperform their counterparts in most states Texas NAEP Data Explorer, NCES (Proficient Scale Score = 238)
But, national and state assessment data still point to large gaps in achievement between different groups of young Texans…
4th Grade Reading achievement in Texas by group Note: Includes only assessments given in English. Source: Texas Education Agency
8th Grade Math achievement in Texas by group Source: Texas Education Agency
Hispanic and Black Students in Texas Less Likely to Score Satisfactory or Above in Reading Source: Texas Education Agency
Hispanic and Black Students in Texas Less Likely to Score Satisfactory or Above in Algebra Note: 38% of students reported as “absent” and not tested. Source: Texas Education Agency
Moreover, you have some new competition: Spurred by our mediocre performance on international exams…
Higher than U.S. average Not measurably different from U.S. average Lower than U.S. average Of 34 OECD countries, the U.S. ranks 12th in reading literacy. U.S.A. OECD “Highlights from PISA 2009,” NCES, 2010
Higher than U.S. average Not measurably different from U.S. average Lower than U.S. average Of 34 OECD countries, the U.S. ranks 17th in science. U.S.A. “Highlights from PISA 2009,” NCES, 2010
Higher than U.S. average Not measurably different from U.S. average Lower than U.S. average Of 34 OECD countries, the U.S. ranks 25th in math. U.S.A. “Highlights from PISA 2009,” NCES, 2010
46 States have adopted new, common “College and Career Ready” Standards… And they are designing far more rigorous assessments to measure student and school performance.
And here—at the college readiness, college going, and college success level—Texas doesn’t have the same lead.
College Going Rate for Recent High School Graduates, 2008 Texas Postsecondary Education Opportunity, “Chance for College by Age 19 by State, 1986-2008”
When High School Dropout Rate is Factored In, the Picture is Different(HS Grad Rate x College Continuation Rate, 2008) 45.8% Texas Postsecondary Education Opportunity, “Chance for College by Age 19 by State, 1986--2008”
Six-Year College Graduation Rates, 2009 62.9% Texas First-time, full-time freshmen completing a BA within 6 years U.S. Department of Education , 2011. United States Education Dashboard. http://dashboard.ed.gov/statedetail.aspx?i=k&id=0&wt=40
Six-Year College Graduation Rates Hispanic, 2009 62.5% Texas First-time, full-time freshmen completing a BA within 6 years U.S. Department of Education , 2011. United States Education Dashboard. http://dashboard.ed.gov/statedetail.aspx?i=k&id=0&wt=40
Six-Year College Graduation Rates African American, 2009 40% Texas First-time, full-time freshmen completing a BA within 6 years U.S. Department of Education , 2011. United States Education Dashboard. http://dashboard.ed.gov/statedetail.aspx?i=k&id=0&wt=40
Six-Year College Graduation Rates White, 2009 72.9% Texas First-time, full-time freshmen completing a BA within 6 years U.S. Department of Education , 2011. United States Education Dashboard. http://dashboard.ed.gov/statedetail.aspx?i=k&id=0&wt=40
Adults Ages 25-64 with at least a Bachelor’s Degree, 2010 37.8% Texas 2010 American Community Survey data from NCHEMS Information Center.
Adults Ages 25-64 with at least an Associate’s Degree, 2010 44.7% 2010 American Community Survey data from NCHEMS Information Center.
So, I get the pushback against assessments and accountability. Especially when budgets are way down and there is almost no professional development for teachers.
But the answer is not to throw away what you have learned over more than two decades of effort.