Download
1 / 164
1.66k likes | 1.79k Views
Education Policy Committee . Kati Haycock President The Education Trust . ACHIEVEMENT IN AMERICA: Where Are We? What Can We Do? Critical Steps for Nevada. Las Vegas Metro Chamber of Commerce Las Vegas, NV April, 2013. America: Two Enduring Stories.

E N D
Education Policy Committee Kati Haycock President The Education Trust
ACHIEVEMENT IN AMERICA: Where Are We? What Can We Do? Critical Steps for Nevada Las Vegas Metro Chamber of Commerce Las Vegas, NV April, 2013
1. Land of Opportunity: Work hard, and you can become anything you want to be.
2. Generational Advancement: Through hard work, each generation of parents can assure a better life — and better education — for their children.
Powerful narratives. Fast slipping away.
Earnings among the lowest income families have declined, even amid big increases at the top. Source: The College Board, “Trends in College Pricing 2011” (New York: College Board, 2010), Figure 16A.
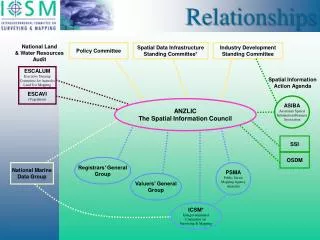
Instead of being the most equal, the U.S. has the third highest income inequality among OECD nations. United States Note: Gini coefficient ranges from 0 to 1, where 0 indicates total income equality and 1 indicates total income inequality. Source: United Nations, U.N. data, http://data.un.org/DocumentData.aspx?q=gini&id=271: 2011
U.S. intergenerational mobility was increasing until 1980, but has sharply declined since. Source: Daniel Aaronson and Bhashkar Mazumder. Intergenerational Economic Mobility in the U.S.,1940 to 2000. Federal Reserve Bank of Chicago WP 2005-12: Dec. 2005.
Now, instead of being the “land of opportunity,” the U.S. has one of lowest rates of intergenerational mobility. Source: Tom Hertz, “Understanding Mobility in America” (Washington, D.C.: Center for American Progress, 2006).
At the macro level, better and more equal education is not the only answer. But at the individual level, it really is.
More Education=More Income Note: Data include full-time, year-round workers, those working less than full-time year-round, and those who did not work. Julian and Kominski, “Education and Synthetic Work-Life Earnings Estimates,” U.S. Census Bureau, 2011.
More Education=Less Unemployment U.S. Bureau of Labor Statistics, Table A-4, http://www.bls.gov/news.release/empsit.t04htm
More Education=More Likely to Vote Note: Data include both those who are and are not registered to vote. U.S. Census Bureau, “Voting and Registration in the Election of November 2008,” May 2010
Note: Data represent percentage of total population that reported volunteering from September 2008 to September 2009 U.S. Bureau of Labor Statistics, “Volunteering in the United States 2009” (2010)
More Education=More likely to be in “Very Good” or “Excellent” Health Robert Wood Johnson Foundation Commission for a Healthier America, 2009
Gallup, “Strong Relationship Between Income and Mental Health” (2007)
What schools and collegesdo, in other words, is hugely important to our economy, our democracy, and our society.
First, some good news. After more than a decade of fairly flat achievement and stagnant or growing gaps in K-12, we appear to be turning the corner with our elementary students.
Fourth-Grade Reading: NAEP LTTRecord performance with gap narrowing *Denotes previous assessment format NAEP 2008 Trends in Academic Progress, NCES
Fourth-Grade Math: NAEP LTTRecord performance with gap narrowing *Denotes previous assessment format Source: NAEP 2008 Trends in Academic Progress, NCES
1996 NAEP Grade 4 Math NAEP Data Explorer, NCES
2011 NAEP Grade 4 Math NAEP Data Explorer, NCES
Over the last decade, all groups have steadily improved and gaps have narrowed *Accommodations not permitted NAEP Data Explorer, NCES (Proficient Scale Score = 299)
Clearly, much more remains to be done in elementary and middle school. Too many students still enter high school way behind.
But at least we have some traction on elementary and middle school problems. The same is NOT true of our high schools.
Achievement is flat in reading. NAEP Long-Term Trends, NCES (2004)
Math achievement is flat over time. * Denotes previous assessment format National Center for Education Statistics, NAEP 2008 Trends in Academic Progress
And gaps between groups are mostly wider today than in the late 80s and early 90s.
12th-Grade Reading: No progress, gaps wider than 1988 *Denotes previous assessment format NAEP 2008 Trends in Academic Progress, NCES
12th-Grade Math: Results mostly flat, gaps same or widening *Denotes previous assessment format NAEP 2008 Trends in Academic Progress, NCES
And these are the students who remain in school through 12th grade.
Students of color are less likely to graduate from high school on time. Source: National Center for Education Statistics, “Public School Graduates and Dropouts from the Common Core of Data: School Year 2008-09” (2011).
Moreover, no matter how you cut the data, our students aren’t doing well compared with their peers in other countries.
Higher than U.S. average Not measurably different from U.S. average Lower than U.S. average Of 34 OECD countries, the U.S. ranks 12th in reading literacy. U.S.A. OECD “Highlights from PISA 2009,” NCES, 2010
Higher than U.S. average Not measurably different from U.S. average Lower than U.S. average Of 34 OECD countries, the U.S. ranks 17th in science. U.S.A. “Highlights from PISA 2009,” NCES, 2010
Higher than U.S. average Not measurably different from U.S. average Lower than U.S. average Of 34 OECD countries, the U.S. ranks 25th in math. U.S.A. “Highlights from PISA 2009,” NCES, 2010
Only place we rank high? Inequality.
Among OECD countries, the U.S. has the fourth largest science gap between high-SES and low-SES students. U.S.A. OECD PISA 2006 Results, OECD, table 4.8b
Among OECD countries, the U.S. has the fifth largest reading gap between high-SES and low-SES students. U.S.A. OECD PISA 2009 Results, OECD, Table II.3.1
We used to make up for at least some of this by sending more of our students to college than anybody else.
Though no longer #1, we’re still relatively strong in overall educational attainment Note: Adults with a postsecondary degree include those who have completed either a tertiary-type B program (programs that last for at least two years, are skill-based, and prepare students for direct entry into the labor market) or a tertiary-type A program (programs that last at least three, but usually four, years, are largely theory-based, and provide qualifications for entry into highly-skilled professions or advanced research programs) Organisation for Economic Co-operation and Development, Education at a Glance 2011 (2011)
But our world standing drops to 15th for younger adults United States OECD Average Note: Adults with a postsecondary degree include those who have completed either a tertiary-type B program (programs that last for at least two years, are skill-based, and prepare students for direct entry into the labor market) or a tertiary-type A program (programs that last at least three, but usually four, years, are largely theory-based, and provide qualifications for entry into highly-skilled professions or advanced research programs) Organisation for Economic Co-operation and Development, Education at a Glance 2011 (2011)
We’re near the bottom in intergenerational progress OECD Average United States Note: Adults with a postsecondary degree include those who have completed either a tertiary-type B program (programs that last for at least two years, are skill-based, and prepare students for direct entry into the labor market) or a tertiary-type A program (programs that last at least three, but usually four, years, are largely theory-based, and provide qualifications for entry into highly-skilled professions or advanced research programs) Organisation for Economic Co-operation and Development, Education at a Glance 2011 (2011)