Download
1 / 36
360 likes | 375 Views
Developing a Safety Scoreboard. Using the Right Metrics. Safety Scoreboard Goals. 1) Stop hoping your safety program will work, start measuring achievement 2) Convince your CEO he / she is measuring the wrong information 3) Define a process with clear expectations

E N D
Developing a Safety Scoreboard Using the Right Metrics
Safety Scoreboard Goals • 1) Stop hoping your safety program will work, start measuring achievement • 2) Convince your CEO he / she is measuring the wrong information • 3) Define a process with clear expectations • 4) Establish a process of accountability
Achilles Heel of Safety • Measuring effectiveness is very difficult to quantify • The only indicator of effectiveness is the lack of an unplanned event…(what?) • CEO wants to know- • How many accidents did you prevent? • How much money did you save?
Why do we keep score? • Determine if “what we do” is good enough. • Did we get the RESULTS we wanted? • Did we our plan work? • We have all been trained since childhood… • Our youth • Star Charts • Sports • Did we win or lose
If we don’t keep score • Can you tell the difference between a game and “play” • Changes the level of commitment • Changes attitude • Changes intensity • People perform with purpose
Scientific Context • The Hawthorne Effect • Studies of employee motivation 1927-1932 • Summary: Employee productivity increased because employees were “singled out, involved, and made to feel important.”. • The act of measurement itself impacts the results
Hawthorne Studies • Hence – • What receives attention is deemed important • What receives time is deemed important • What is recognized by the organization is deemed important • AND • What is MEASURED---GETS DONE
Safety Score? • Measures usually based on accidents, which are unplanned. • Usually include hindsight, reviewing and comparing year long comparisons • Lacks antecedents that lead to changes. What drives results?
Risk Management- What do we measure? • Incident rates • Lost days • DART rates • Industry comparisons • Experience Modifier • Cost comparisons
Managing Risk • If the goal is to manage risk and ultimately decrease injuries and reduce cost then it must be managed. • You cannot manage what you do not measure. • What you measure must directly influence results.
Managing Risk • Safety needs to be intentional • Achievement oriented • Measureable (but what do you measure?) • Identified management accountability • Included on performance reviews • Recognized by management as part of the process
The Problem • CEOs expect results • But…results are lag measures. • Safety is in the middle, experimenting. • Training and re-training • Safety committees that are not effective • Feel unable to change the culture • Feel it is “unfair” to judge them on subordinates performance
Results vs. Activities Results By: Dan Peterson Activities
Lead Indicators • Lead indicators are: • Actionable today—did you do it or not? • Measurable • Observable • Lead indicators INFLUENCE the lag measures. • Leads are a bet that if we do “x” then “y” will improve
Progress • W. Edwards Deming: • 96% of our issues are from “How operations are run” • 4% of issues are from people • Operations are often left out of the formula because we focus on people.
Quality Production Safety
Complaints… • I don’t have time • Too busy • Not important today • If it is deemed important by the CEO it will get done. • This is a change, expect resistance
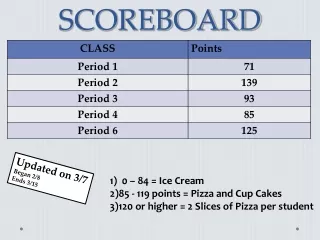
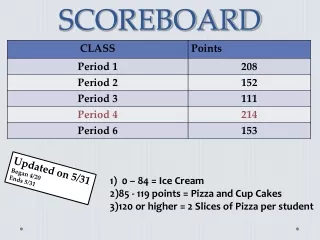
A note about scoreboards • Keep it SIMPLE…did you win or not? • Post it in a noticeable area • Be creative
Loss Prevention Risk Alert Actions: Risk Alerts Contacted within 7 days Goal= 100% As of 4/15/09
Claims: Yellow Flag Action100% Acted Upon within 14 days As of 5/8/09
Scoreboards • Decide the key activities that will influence the lag measures • Measure activities and effectiveness • Tie rewards / recognition to completion of activities • Use scoreboards to improve accountability