Download
1 / 22
240 likes | 395 Views
Total Analytical Error Evaluation in Quantitative and Qualitative Assays. May F. Mo FDA/Industry Statistics Workshop Washington, DC - September 29, 2006. Background. Total Analytical Error (TAE) NOT a new concept

E N D
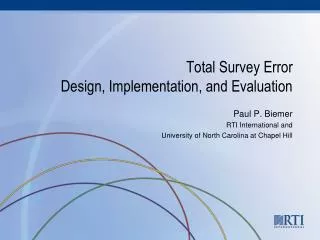
Total Analytical Error Evaluation in Quantitative and Qualitative Assays May F. Mo FDA/Industry Statistics Workshop Washington, DC - September 29, 2006
Background Total Analytical Error (TAE) • NOT a new concept • Assay errors from all sources of the data collection experiment – including systematic and random error • CLSI Proposed Guideline January 2002 • CLSI Approved Guideline April 2003 • FDA/Industry collaboration in developing the guideline
Cause and Effect Diagramfor Total Analytical Error(from EP21-A)
Importance of TAE • For Clinicians • TAE provides a metric of assay quality that can directly equate to medical errors • For Laboratories • TAE provides a simple, cost effective method for comparing assay products • For Manufacturers • TAE guides manufacturers to set appropriate design goals and evaluate the product directly to user needs
TAE Evaluation Methods TAE is evaluated by assessing if the combination of errors from all sources is within some acceptance limit. The common evaluation methods are (Krouwer, 2002): • Direct Estimation • Indirect Estimation • Simulated Estimation Note: All methods are based on the quantitative assays.
Direct Estimation Direct Estimation (Distribution of Differences Method) • EP21 Recommendation • Calculate differences of study assay vs. reference assay • TAE limit estimated as the CLI of the differences - No need to estimate and combine individual source errors • Visual tools - Bland & Altman and “Mountain Plot”
Direct Estimation (Continued) • Is distribution of differences normal? Parametric? Nonparametric? or Data Transformation? • Tolerance Interval: A range that contains a specified proportion of a sampled population with a specified confidence. (EP21) • Parametric or nonparametric methods to report tolerance intervals are covered in Statistical Intervals by Hahn and Meeker (1991).
Tolerance Interval (TI) Calculation A two-sided 100(1-)% TI to contain at least 100p% of the sampled differences from a sample of size n: • Parametric: where k depends on , p and n, and can be obtained from published tables, or derived using noncentral t-distribution (Odeh and Owen, 1980) • Nonparametric TI based on rank statistics is [x(l), x(u)]. The value of l and u depend on , p and n, and can be derived using published tables, or using equation provided in Hahn and Meeker (1991)
Indirect Estimation • Indirect Estimation (Simple Combination Model) • TAE = Bias + k * Imprecision • Simple to apply • Fits well with the Six-Sigma quality concepts • Not recommended by EP21 - Underestimate TAE • Simulation Method (Research Use) • Cost-efficient • Model the impact of an individual error component to TAE • Can underestimate TAE
Industry PracticesQuantitative Assays • Set Product Requirement • Set allowable TAE (aTAE) limit based on medical opinion and marketing needs • Break aTAE down to precision and bias design requirements using simple combination model. Example: TAE = Bias + 2*SD (for 2 sigma performance) • Design Verification and Validation • Verify design requirements individually • A direct assessment of total error should be conducted to ensure aTAE is met.
Industry PracticesQuantitative Assays • TAE Claims in Package Inserts • Not Yet Common • Concerns? • Indirect method – Is it sufficient to establish a TAE claim? • Direct method - When the reference assay is not a “gold standard”, TAE has measurement error from both assays … How to interpret? • User environment – Are our customers ready to use TAE claims in the package inserts?
Generalize TAE toQualitative Assays Motivation • TAE provides rationale to establish product requirements • TAE provides a final metric to evaluate if a product meets medical needs Challenge • TAE is a quantitative concept • TAE does not apply to low negative and high positive samples
TAE in Qualitative Assays The performance of a qualitative assay relies on its precision and bias near the medical decision point (cutoff) … • TAE evaluation applicable and desirable for the cutoff zone • Direct estimation not realistic due to limited patient samples around cutoff • Indirect modeled approach may be more practical
aTAE in Qualitative Assays How to define aTAE for the near cutoff zone? EP12-A Guidance: • The 95% interval - the values above and below the cutoff point at which repeated results are 95% positive or 95% negative, respectively • Grayzone - the zone of uncertainty between the 95% interval limits
aTAE in Qualitative Assays Grayzone 5% 5% Upper 95% Interval Lower 95% Interval Cutoff
aTAE in Qualitative Assays Set aTAE for the near cutoff zone • Incorporating measurement errors from both precision and bias, aTAE can be set as ½ of the grayzone. That is, the test result at 1.2 S/CO should read as positive (>1.0 S/CO) while test results at 0.8 S/CO should read as negative (<1.0 S/CO). Assuming that grayzone is 0.8-1.2 S/CO for an assay, aTAE will be 0.2 S/CO or 20% (assuming cutoff=1.0 S/CO) • When the above aTAE is met, there should be < (i.e., 0.05) probability that a test results will deviate >20% from the true value, and cause a change in the final interpretation.
aTAE in Qualitative Assays Set aTAE for the near cutoff zone • For an assay that reports an indeterminate result, aTAE can be extended as the size the grayzone. • The test result at 1.2 S/CO should not read as negative (<0.8 S/CO) while test results at 0.8 S/CO should not read as positive (>1.2 S/CO). In this case aTAE can be set at 0.4 S/CO or 50% for results around 0.8 S/CO and 33% for results around 1.2 S/CO.
TAE Evaluation for Qualitative assay • Direct Evaluation – Not realistic • Indirect Evaluation • TAE = Bias + * Precision Challenge: How to define and measure Bias? How to include ALL bias sources? • Alternative: TAE = * Reproducibility Reproducibility includes variations contributed from instrument, lot, calibration, operator, etc … • Underestimate TAE is still then main concern
TAE in Qualitative Assays How do different types of bias impact TAE? • Bias impacts both S and CO • As a proportional bias The will be no bias in S/CO • As a fixed bias The bias in S/CO is unknown and depends on the value of S relative to CO (=1.0) and size of the bias
TAE in Qualitative Assays How does different type of biases impact TAE? • Fixed bias for both S and CO: The impact on S/CO is relatively small for the near cutoff range (0.8-1.2 S/CO) • Biases that impact S and CO differently: • Interferences • Tube Type • Storage • Sample Carry Over • Crossreactivity …
Conclusion TAE is an useful evaluation method for both quantitative and qualitative assays. For qualitative assays, TAE should be evaluated for the near cutoff zone using indirect estimation. Since indirect method underestimates TAE, it may not be sufficient to support a claim.
References • NCCLS. Estimation of Total Analytical Error for Clinical Laboratory Methods; Approved Guideline. NCCLS Document EP21-A [ISBN 1-56238-502-X]. NCCLS, 940 West Valley Road, Suite 1400, Wayne, Pennsylvania 19087-1898 USA, 2003. • NCCLS. User Protocol for Evaluation of Qualitative Test Performance; Approved Guideline. NCCLS Document EP12-A [ISBN 1-56238-468-6]. NCCLS, 940 West Valley Road, Suite 1400, Wayne, Pennsylvania 19087-1898 USA, 2002. • Hahn GJ, Meeker WQ. Statistical Intervals: A Guide for Practitioners. New York: John Wiley and Sons, 1991. • Krouwer JS, Monti KL. A simple graphical method to evaluate laboratory assays. Eur J Clin Chem Biochem 1995; 33:525–7. • Odeh, RE, Owen, DB. Tables for Normal Tolerance Limits, Sampling Plans, and Screening. New York Marcel Dekker, 1980.