Download

1 / 72
911 likes | 1.36k Views
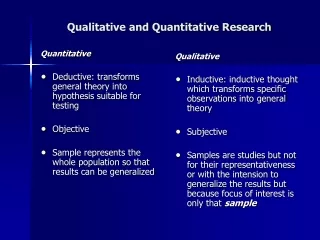
Qualitative and Quantitative Information. Outline of Chapter. Level of Measurements Point Symbol Qualitative (Nominal) information Quantitative information Linear Symbol Qualitative (Nominal) information Quantitative information Ordinary Symbol Flow Line Symbol Areal Symbol

E N D
Outline of Chapter • Level of Measurements • Point Symbol • Qualitative (Nominal) information • Quantitative information • Linear Symbol • Qualitative (Nominal) information • Quantitative information • Ordinary Symbol • Flow Line Symbol • Areal Symbol • Qualitative (Nominal) information • Quantitative information • Choropleth Maps • Classed Choropleth Maps (Equal Step, Quintile, Natural break, minimum variance) • Un-classed Choropleth Maps • Surface Symbol • Isolines • Isometric lines • Isopleths lines
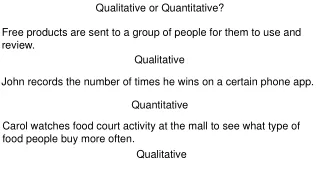
Level of Measurement The level of measurement refers to the relationship among the values that are assigned to the attributes for a variable. • Nominal (The word "nominal" means "in name.") • Level of data measurement that is non comparative, usually representing a description or name • Ordinal (The word "ordinal" means "in order.") • Ranked data (e.g., good, better, best) that are comparable only within a given spectrum. • Interval • Ratio
Nominal Level • The least precise level of measurement is the nominal level. Example of nominal-level variables are • Sex (with the categories of male and female), • ethnicity (categories could include African American, Latino, and white), • Political Party Identification (Democrat, Republican, Independent, etc.) and • Religion (Catholic, Protestant, Jewish, Hindu, Buddhist, etc.).
Ordinal Level • If we had a variable whose categories did have an order, we might have an ordinal-level variable • Example is "social class," with categories such as lower class, working class, middle class, and upper class.
Interval Level • Interval scales are numerical scales in which intervals have the same interpretation throughout. • As an example, consider the Fahrenheit scale of temperature. The difference between 30 degrees and 40 degrees represents the same temperature difference as the difference between 80 degrees and 90 degrees. This is because each 10 degree interval has the same physical meaning.
Ratio Level • The highest level of measurement is the ratio level. • Variables measured at the ratio level have all the characteristics of nominal-, ordinal-, and interval-level measures
Types of Cartographic Symbols • Point symbols • Line symbols • Area symbols
Characteristics of Cartographic Symbols • Shape • Size • Hue • Tonal value • Texture • Orientation Size Shape Value Bertin’s Six Retinal Variables Orientation Texture Hue
Point Symbols • Point data can be symbolized at a point or aggregated at a point • Point symbols are quantitative or qualitative • Nominal point symbols maps • Ordinal point symbols maps • Proportional point symbols maps
Graduated Point Symbols : • True proportional symbols maps • Range-graded symbols • Other graduated symbols maps Types :
True Proportional Symbols Maps: • The data is ranked on a measured scale. • The size of each symbol is proportional to the value of the feature on the scale. • Interval/Ratio data types :
Range-graded Symbols: • The data is ranked on a measured scale. • The data is divided into ranges: • Quartile, natural breaks and user defined • Symbol size is based on the range in which the value falls • Quantiles> It is approach • Quintile > If data divided in 5 equal parts • Quartile > If data divided in 4 equal parts • Decile > If data divided in 10 equal parts
Dot Maps: Dot value too small
Dot Maps: Dot value too large
Dot Maps: Appropriate dot size and value
Symbolizing Data with Lines: • Qualitative linear symbols: • Coastlines • Graticules • Trails • Roads • Other
Symbolizing Data with Lines: • Qualitative linear symbols:
Symbolizing Data with Lines: • Quantitative linear symbols: • Traffic flow • Transportation volume • Migration
Choropleth Maps • Classless choropleth map • one color/shading pattern per attribute value • impractical as it is difficult to interpret • Classed choropleth • easier to interpret with fewer color/shading patterns, usually 5-20 different classes • 3 steps 1. attribute data classification 2. color / shade pattern assignment 3. custom design
1. Attribute data classification • converting interval/ratio data into ordinal data) • to group attribute values into a distinct number of ranked classes, usually 5-20 classes • data classification methods • equal interval • equal frequency or even grouping (Quintiles) • natural break or user specified • different methods are selected to convey a different message or distributional pattern • An example is provided on the next page to show results of different data classification methods • with 19 observations • assuming 5 ordinal classes • by means of graphing sorted data
User 4 = 3 Class 5 = 3 User 3 = 7 Class 4 = 5 Ranked data values Class 3 = 7 User 2 = 7 Class 2 = 2 User 1 = 2 Class 1 = 2 Frequency Even 5 = 3 Even 4 = 4 Even 3 = 4 Even 2 = 4 Even 1 = 4 Total number of observations = 19 Class # show results of equal interval data classification for 5 classes Even # show results of equal frequency (quintiles) data classification for 5 classes where the approximate number of observation per class = 19/5 = 4 User # show results of the natural break data classification where the total number of classes could be 4 or 6
Equal Interval This map doesn’t show much information! Quantiles Whether this map is good depends on the purpose of the map. Classed Choropleth Maps Standard Deviation This map is useless because there can’t be negative people per square mile!
Isolines • Device for showing spatial distribution. • Refers to any line that joins points of equal value. • Common types of isolines • Contour line (Equal Elevation) • Isobar (A line of equal or constant pressure) • Isotherm (A line of equal or constant temperature) • Isohyet (A line of equal amounts of precipitation) http://www.theweatherprediction.com/basic/isopleths/
Basic Characteristics of Isolines • Closed lines, having no end. • Represent gradations in quantities. • Maintain a constant interval between them. • Closeness depends on gradient (slope).
Type of Isolines • Isometric lines • Based on control points • Isopleths • Based on areal averages
Isopleth Maps • Areal statistics shown
Prism Maps http://www.sciencesoftware.com/MapViewer.asp
Choropleth Mapstonal shadings are graduated to represent areal variations in number or density within a region, usually a formal region.
Choropleth Mapstonal shadings are graduated to represent areal variations in number or density within a region, usually a formal region.
Choropleth Mapstonal shadings are graduated to represent areal variations in number or density within a region, usually a formal region.
Categorizing Data for Choropleth Maps Raw Data Equal Intervals Standardized Data Equal Intervals Quantiles Natural Breaks