Download
1 / 17
170 likes | 417 Views
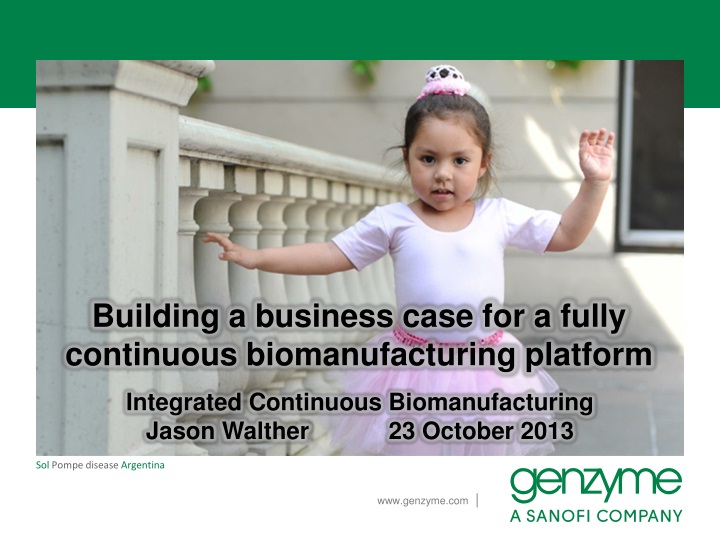
Building a business case for a fully continuous biomanufacturing platform. Integrated Continuous Biomanufacturing Jason Walther 23 October 2013. Sol Pompe disease Argentina. |. www.genzyme.com. Fully continuous biomanufacturing platform.

E N D
Building a business case for a fully continuous biomanufacturing platform Integrated Continuous Biomanufacturing Jason Walther 23 October 2013 Sol Pompe disease Argentina | www.genzyme.com
Fully continuous biomanufacturing platform • Genzyme developing a continuous integrated platform • Technical results are promising • But can we justify the platform from a business perspective? • And can we use economic modeling to guide development?
Economic drivers for the continuous platform • Can we quantify these advantages and disadvantages?
Financial valuation methodology • Estimate CAPEX/OPEX using BioSolve software • Estimate platform dev costs and lay out a future product timeline • Predict discounted cash flows for legacy & continuous platforms • Calculate financial indicators (e.g., NPV) and make assessment Facility Estimates Cash Flow Projections Financial Indicators CAPEX/OPEX savings using the new platform Discount future costs CVI, NPV, IRR, etc. Assessment Develop-ment Costs Launch Scenarios Inputs Outputs
Facility estimates: CAPEX and OPEX • Use BioSolve software package • Define process (unit ops, scaling rules, assumptions) • Calibrate cost data (equipment, materials, labor, etc.) • Benchmark against previous internal and external projects • Biosolve capital estimates are acceptably accurate
Facility estimates: Platform assumptions mAb 500 kg/y Legacy Platform Continuous Platform US DS Time IVCD Titer US DS Time VCD Titer US DS Time VCD Titer Fed-batch 1X10,000L SS Batch 12 days 3000 Mcell·h/mL 3.5 g/L Suspension perfusion 2X500L SU Continuous 60 days 100 Mcell/mL 1.4 g/L Suspension perfusion 1X500L SU Continuous 60 days 100 Mcell/mL 0.5 g/L Enzyme 20 kg/y US DS Time VCD Titer Microcarrier perfusion 2X2,000L SS Batch 60 days 5 Mcell/mL 0.05 g/L
Facility estimates: Platform assumptions mAb 500 kg/y CAPEX ($M) OPEX ($/g) Legacy 2X 1.2X 1X 1X Enzyme 20 kg/y Continuous 50X 3X 1X 8X
Cost impacts of the fully continuous platform mAb CAPEX mAb OPEX % overall cost Overall: –20% Overall: –54%
CAPEX/OPEX sensitivity analyses Red = More Savings OPEX Savings (Fed-Batch mAb – Continuous mAb) CAPEX Savings (Fed-Batch mAb – Continuous mAb) • Financial estimates can guide process development • (For example, CSPR and VCD targets) break-even Push to high VCD, low CSPR Cell-Specific Perfusion Rate break-even Viable cell density
CAPEX/OPEX sensitivity analyses Red = More Savings ΔNPV for a single facility (Fed-Batch mAb – Continuous mAb) • Financial estimates can guide process development • (For example, CSPR and VCD targets) break-even Push to high VCD, low CSPR Cell-Specific Perfusion Rate Viable cell density
Financial valuation methodology Facility Estimates Cash Flow Projections Financial Indicators CAPEX/OPEX savings using the new platform Discount future costs CVI, NPV, IRR, etc. Assessment Develop-ment Costs Launch Scenarios Outputs Inputs
Product launch scenario • Create a hypothetical product timeline with various mAb and enzyme product launches • Calculate NPV for two scenarios • Legacy platforms (fed-batch and microcarrier perfusion) • Universal continuous platform • Compare NPVs to estimate value of new platform • 2025 • 2026 • 2027 • 2028 • 2029 • 2030 • 2031 • 2032
Advanced Modeling – An Integrated Approach In partnership with Biopharm Services Ltd. Sales Profiles Product Definition Dashboard Development Profiles Product NPV Stocking Strategy Portfolio NPV ManufacturingNetwork
Relative cash flow projections • Clear benefits to new platform (given the assumptions) • Hundreds of millions of dollars in potential savings ΔNPV for product portfolio mAb OPEX Enzyme OPEX mAB CAPEX Enzyme CAPEX Development Cost discount rate = 7%
Relative cash flow projections • Different product launch scenarios can be investigated • Continuous platform competes in a variety of scenarios ΔNPV for product portfolio High demand Medium demand Low demand
Conclusions • Infrastructure in place for economic modeling of future platforms • Preliminary analysis shows strong, quantifiable business drivers for continuous platform • We will continue to revisit and improve assumptions • Additional sensitivity analyses • Expand comparisons to other platforms (e.g., disposable FB) • Process development guidance • Cell density and CSPR are influential upstream parameters • Similar parameters will be found for downstream process
Acknowledgments • Genzyme Late Stage Process Development • Genzyme Capital Finance • Genzyme Industrial Affairs • Sanofi Biologics Research & Development • Biopharm Services