Download
1 / 23
230 likes | 234 Views
Biology. Ecology Energy flow Matter Cycling Populations. Topics Ecosystem energy flow Cycles in an ecosystem Limiting Factors Population Growth Graphs. Essential Questions Explain the ways in which energy flows through an ecosystem.

E N D
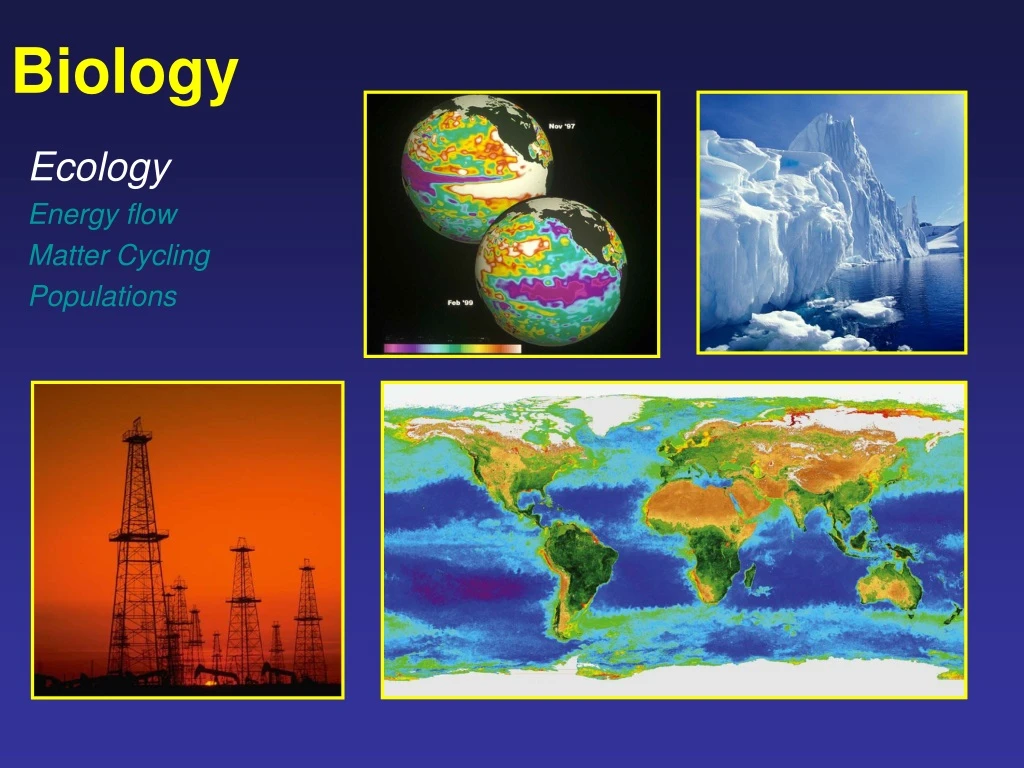
Biology Ecology Energy flow Matter Cycling Populations
Topics Ecosystem energy flow Cycles in an ecosystem Limiting Factors Population Growth Graphs Essential Questions Explain the ways in which energy flows through an ecosystem. What role does the carbon cycle play in photosynthesis and cellular respiration? How are communities influenced? What are the major limiting factors that influence carrying capacity? What do population growth graphs look like? Can you identify them? Ecology
Energy Flow The Sun Sunlight is the main energy source for life on Earth. Some types of organisms rely on the energy stored in inorganic chemical compounds. Plants use the energy from sunlight to carry out the process of photosynthesis. Other autotrophs, such as sulfur bacteria, use the energy stored in chemical bonds for chemosynthesis. In both cases, energy-rich carbohydrates are produced.
Energy Flow Autotrophs / Producer – An organism that can capture energy form sunlight or chemicals and use it to produces its own food. Photosynthesis The process by which producer take carbon dioxide and water and convert it into sugar and oxygen. (Carbon dioxide + Water Sugar + Oxygen) take place in the chloroplast Heterotrophs / Consumer – Organisms that rely on other organisms for their energy and food supply Cellular Respiration The process that releases energy by breaking down glucose and other food molecules in the presence of oxygen. (Sugar + Oxygen Carbon Dioxide and Water) takes place in the mitochondria
Light Carbon dioxide Glucose sugar oxygen water Photosynthesis:CO2 + H2O C6H12O6 + O2 CO2 + H2OC6H12O6 + O2 Cellular Respiration Photosynthesis
Energy Flow: Food Chains Producer (Autotrophs) Primary Consumer (Heterotrophic) example Secondary Consumer (Heterotrophic) Tertiary Consumer (Heterotrophic) Top level Consumer (Heterotrophic)
Energy Flow Energy flow in a food web/chain decreases at each succeeding organism in a chain or web. The dry weight of all organic matter within the organisms of a food chain/web is called biomass. • Trophic levels are feeding levels for organisms within an ecosystem, • Producers belong to the first trophic level. • Primary consumers belong to the second trophic level. • Secondary consumers belong to the • Third trophic level.Detritivores and decomposers process detritus from all trophic levels. Eating at a lower Trophic level
Energy Flow: Ecological Pyramids Energy flow - Extinction
Energy Flow: Ecological Pyramids Ecological pyramids show the decreasing amounts of energy, living tissue, or number of organisms at successive feeding levels. The pyramid is divided into sections that represent each trophic level. The area of each level symbolizes the amount of energy or matter remaining at that level. Because each trophic level harvests only about one tenth of the energy from the level below, it can support only about one tenth the amount of living tissue.
Energy Flow: Food Webs What does the Marsh Hawk feed on? What would happen if a chemical was introduced that limited the growth of Marsh Grass?
Tropic Levels Ecological efficiency is the term that describes the percentage of usable energy transferred as biomass from one trophic level to another and ranges from 2%-40% with 10% being typical. The greater number of trophic levels in a food chain, the greater loss of usable energy.
The Flow of Energy And the Cycling of Matter Cycling of Matter Biogeochemical Cycles
The Flow of Energy And the Cycling of Matter Keeping up with Carbon Carbon Cycle
Populations change in size density dispersion age structure Population density —the number of individuals of a population that inhabit a certain unit of land or waterarea. Population dispersion—refers to how individuals of a population are spaced within a region. The Study of Population Dynamics Age structure of a population is usually described as the pre-reproductive stage, the reproductive stage and the post-reproductive stage. A population with a large reproductive stage is likely to increase, while a population with a large post-reproductive stage is likely to decrease.
Ecosystem Factors Ecosystem characteristics include a range of tolerance to physical and chemical environments by the ecosystem's populations Law of tolerance: The distribution of a species in an ecosystem is determined by the levels of one or more physical or chemical factors being within the range tolerated by that species. Mini Lab: Range of tolerance
Ecosystem Factors The limiting factor principle states that too much or too little of any abiotic factor can limit or prevent growth of a population, even if all other factors are at or near the optimum range of tolerance. An abiotic factor such as lack of water or poor soil can be understood here The Sugar Maple
Populations limiting Factors No population can grow indefinitely due to limited resources such as light, water, and nutrients and also due to competitors and/or predators.
Biotic Potential vs. Environmental Resistance The biotic potential max (rmax) is the population's capacity for growth. The intrinsic rate of increase (r) is the rate of population growth with unlimited resources. environmental resistance consists of factors that limit population growth. limiting Factors No population can grow indefinitely due to limited resources such as light, water, and nutrients and also due to competitors and/or predators.
Density-independent population controls affect a population's size regardless of its density. These are abiotic factors in the community. Density-dependent factors or population controls have a greater affect on the population as its density increases. Infectious disease is an example of density-dependent population control. • Limiting Factors Examples: Extrinsic Biotic – Density Dependent Abiotic – Density Independent • Intrinsic • Social Hierarchy • Gender changing
Biotic Potential v. Environmental Resistance (Logistic Population Growth) Carrying capacity (K) is determined by biotic potential and environmental resistance. (K) is is the number of a species individuals that can be sustained indefinitely in a specific space. As a population reaches its carrying capacity, its growth rate will decrease because resources become more scarce. Environmentalresistance Carrying capacity (K) Population size (N) Biotic potential Exponential growth Time (t) Exponential Growth Lessons of Kaibab
The Role of Predation in Controlling Population Size Interactions between predators and their prey change in cycles and appear to be caused by species interactions, but other factors may be involved. Example: Yellowstone Wolves
Age structure Age structure of a population is usually described as the pre-reproductive stage, the reproductive stage and the post-reproductive stage. A population with a large reproductive stage is likely to increase, while a population with a large post-reproductive stage is likely to decrease.