Download
1 / 9
90 likes | 206 Views
Council Snowmelt 2000. Image Courtesy Bob Huebert / ARSC. Council Snowmelt 2000. Council Snowmelt 2000. Snow Surveys, Council Alaska Julie Knudson & Anne Carr, Water and Environmental Research Center, University of Alaska

E N D
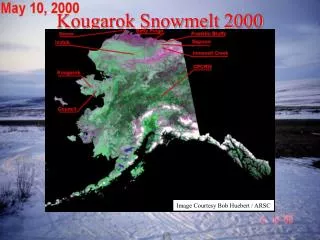
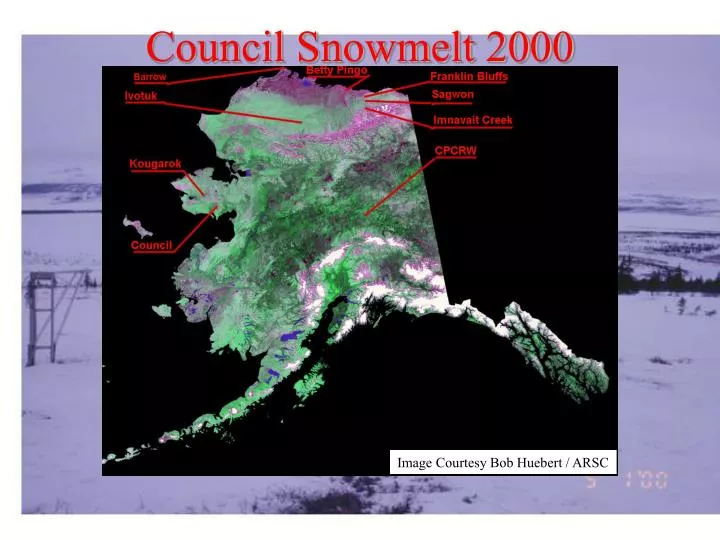
Council Snowmelt 2000 Image Courtesy Bob Huebert / ARSC
Snow Surveys, Council Alaska Julie Knudson & Anne Carr, Water and Environmental Research Center, University of Alaska Comprehensive snow surveys were performed on both the Melsing Creek and Guy Rowe drainages to establish the pre-melt snow cover. Daily snow survey sites were also established at a representative forest, shrub, and tundra site within the Melsing Creek watershed, where snow pits were dug, ablation poles installed, and daily depths and snow water equivalent were measured. For every snow water equivalent measurement, double sampling was used. Ten snow densities were collected and 50 depths were measured. At each site ablation stakes were installed along a transect that trended east/west. Three stakes were installed at each site approximately 25 feet apart with the entire transect 50 feet long. The 50 depths were measured on a line parallel to the ablation poles and were taken approximately every 2 feet on both the north and south side of the line. In addition, the ablation poles were also read and these results were plotted for each pole.
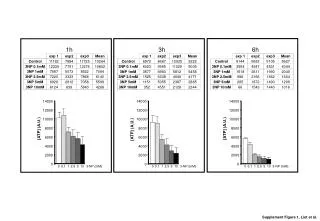
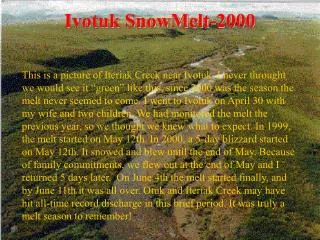
There were two warming trends observed, with a period of refreezing in between. In response to the refreezing, the river stage dropped with the temperature. May 7 represented the start of the initial melt, with day temperatures above 0oC. Temperatures remained above 0oC at night for the first time on May 16. The ablation graphs show this first melt period occurring between May 11-May 20, with the dates fluctuating dependent on the site. The temperature began to drop approximately on May 18 and remained cold until May 23. The second melt period responded to warming temperatures by May 27, with nightly temperatures again above 0oC by May 29. The first major rain event occurred May 31- June 2, this corresponds to the peak discharge on Melsing Creek. Complete melt occurred at the Shrub site on May 30 and the Forest site on June 3. The last measurement at the Tundra site occurred on June 9, with an estimated 4 days until complete melt in the entire basin.
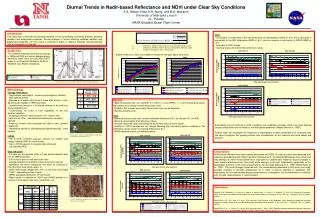
Shrub Site Tree Site Tundra Site
Snowpack ablation during spring, 2000 displays remarkable variability among the many sites where snowmelt processes were monitored.
Anne Carr Julie Knudson Funding for this research was provided by the National Science Foundation Arctic Systems Science Program (Grant No. OPP-9818066).