Download
1 / 35
350 likes | 425 Views
Regional Sediment Management Benefits. Kevin Knight, Economist Institute for Water Resources US Army Corps of Engineers. Why Identify & Quantify RSM Benefits?. Communicate Benefits of Using a Systems Approach Engage partners and stakeholders in RSM

E N D
Regional Sediment Management Benefits Kevin Knight, Economist Institute for Water Resources US Army Corps of Engineers
Why Identify & Quantify RSM Benefits? • Communicate Benefits of Using a Systems Approach • Engage partners and stakeholders in RSM • Better problem understanding; more creative solutions; leverage resources to plan and implement • Accomplish more effective, efficient, & acceptable water resource problem solving
Report Summary & What’s Next? • Identify/document the range of RSM benefits • Highlight the order of magnitude • Demonstrate universality • Discuss how we can better capture RSM benefits
Categories of Benefits • Documented Savings • Estimated Savings • Hypothetical (Potential) Savings • Qualitative Savings
Reductions in Mobilization/Demobilization and Dredging Costs • Jacksonville District $1.4 million for St. Augustine Inlet & $1 million for Matanzas Inlet • NY District $2 million for Sandy Hook-Sea Bright • Mobile District $370,000 for East Pass IMP • Port of Houston $23 million ($2 million mob/demob) and over $20 million in dredging
Savings in Environmental Study Costs • Portland District saved at least 12 months of in-house labor (or $104,000) through blanket clearances • Sea Bright NPS saved $500K (EIS vs. EA) • LA’s future DMMP cost savings as a result of CSBAT ~$200,000
Reduction in Volume or Frequency of O & M Dredging • Perdido Pass ~$425,000/yr
Reduction in Dredging Volumes • New Orleans’ West Bay Diversion Project • District spent $3.6 million in unnecessary dredging and is expected to spend $1.75 million every three years • Now using RSM approach – anticipate less shoaling and reduced costs • Lake Michigan strategically accreted material in littoral zone reduced harbor dredging costs by $330,000
Extending Lives of Disposal Sites • Estimated costs of identifying & developing new sites • $185,000 to $1.8 million • Potential life cycle costs for new disposal site > $48 million (based on NAB’s DMMP) • Helps better justify O & M • RSM approach can help reduce these costs
Avoiding Upland Disposal and Associated Costs • Piping $20/cy • Trucking $50/cy • Apalachicola, Black Warrior, & Tombigbee Rivers • Savings of $23/cy • Savings in Land Costs • $14/ft2 or $48 million for 80 acre site in LA County
Extending Infrastructure Lives • Deferred/Avoided Repair Costs • $3.84 million/yr to maintain MCR jetties • $5,000/ft for construction • Coos Bay Breach $19 million for North Jetty alone • MCR supports $16B in commercial navigation • Great Lakes Infrastructure • $ 5 billion, 80% of coastal facilities are >50 years • O & M averaged $60 million - $80 million/yr (though its funding has been declining)
Reduced Costs of Treating Contaminated Dredged Material • $30/cy to $500/cy ($1,285/cy!!!) for oxidation and/or incineration methods
Reduced Likelihood/Frequency of Emergency Dredging • $20/cy for routine maintenance • $50/cy to $65/cy for emergency dredging e.g., SF $1.5 million for an episode in 1996 (in 2009 $) • Wailoa Harbor Emergency Dredging = $994,000 to remove 25,000 cy of sand (dredging only) • St. Joseph Harbor, Michigan (March 2009) $1 million • RSM partnerships facilitate using material consistent w/ regional needs avoiding missed opportunities, streamlined permitting, etc.
Reduced Costs of Beach Nourishment • St. Johns County vs. Duval County* $4.77/cy savings • Coney Island saved $66K in backpassing and $267K in bypassing for a total savings of $333K • Long Island 6 Inlet Projects totaling $1.95 million • New York District’s Rock Sharing Program from jetties and groin rehab projects (Savings >$1 million over past 10 yrs)
Fewer Beach Nourishment Downdrift • Philadelphia District--Cape May bypassing found to eliminate 4 nourishment cycles totaling $3.4 million or $182,000 annually
Increased Navigation Efficiencies • Reduced Light Loading or Greater Economies of Scale • Western Chesapeake Bay = $300,000 • Additional Trucking Costs Hancock River = $187,000 • Reduced relocation costs for fishermen • Port of Brownsville’s lack of O & M cost $135,000 per vessel in tidal delays or via Mexican port • Port of Green Bay rerouted vessels • Monitoring Costs of Shoaling
Increased Navigation Efficiencies • Reduction in Navigation Hazards Associated with Shoaling • In 2006, Noyo Harbor fishing vessel ran aground • Clean up Costs ~$100,000 • Subsequent Delays = $200,000
Reduced Coastal Erosion Damage • Cape Cod Canal • Structural Damage • Damages to Roads • Recreation Benefits • Wrightsville Beach • $36 million in damageable property vs. $12,000,000 to bypass sand
Shore ProtectionBenefits (con’t) • RED Effects • Income • Expenditures • Jobs • Property Values • Increase Tax Base • Additional sales tax from beach-related industries • Additional property tax collected
RED Impacts • Increased Tourism • California Beach Fill - 50,000 to 400,000 cy would result in $70,000 to $600,000 overall increase in taxes (King, 2006) – The Economics of Regional Sediment Management in Ventura and Santa Barbara Counties
Shore Protection Benefits (con’t) • OSE Impacts • Additional Recreation Opportunities • Improved Quality of Life • Public Safety
Coastal Storm Damage Reduction • Storm Surge Buffer • Protection of Populations and Structures • Reduced Federal Disaster Recovery Costs Total = Tens of Millions Prevented (USACE Wilmington District, Dec. 2000, 00-R-6) – Hurricane Fran Effects on Communities with and without Shore Protection: A Case Study at Six North Carolina Beaches
Combining Dredging and Nourishment • Carpinteria, Goleta, Rincon Beaches - Benefit/cost ratios range 2:1 to 44:1 “The Economics of Regional Sediment Management in Ventura & Santa Barbara Counties”
RSM Outreach & “Resilience” • New England District • Quicker decision (Bridgeport, CT example) • Avoided missed opportunity to use sediment • Saved costs • Growing political support for RSM • State participation (e.g. mapping) • Mobile District • Post Hurricane Ivan • Emergency dredging; habitat restoration; reduced time to construct and for environmental clearances • Stimulus Package??
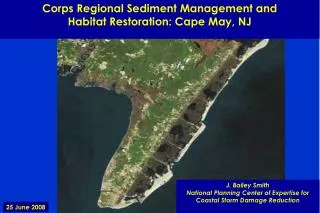
Partnership benefits • Declaration of Cooperation for RSM Planning (Mouth of Columbia) • WA, OR, Estuary Program, NMFS, Corps, other • Supportive resource agencies (Cape May, NJ) • Political support for RSM approach • Sec 2037 WRDA 07 – amendment to CAP 204
Increased “Flexibility” of Dredging/Disposal • Pascagoula = better relationships with regulatory agencies led to add’l options for dredged material placement • Wilmington = stockpile material rather than going offshore • Keeping material available
Contribution to Species Recovery • Piping Plover (Cape May, NJ) - 1993 Breeding Season ~ $1.8 Million • Atlantic Salmon (Gulf of Maine) - ~ $36.6 Million for First 3 Years • Bull Trout (Puget Sound, WA) - ~ $68 Million Over 25 Years • Walla Walla District – salmon mitigation, habitat restoration
Benefits of Sharing Information • Increased efficiency • Operational benefits • Strategic benefits • External benefits • B/C Ratios range from 4 to 6 “ASSESSING BENEFITS OF GEOGRAPHICAL INFORMATION SYSTEMS IMPLEMENTATION” Franz-Josef Behr
Avoided Duplication Costs • New Orleans used Mobile Data • Taking advantage of Mobile investment ($250,000); MVN costs reduced to $40,000 • Other examples?
Additional Benefits • Fewer/Smaller Lawsuits • Reduction in Environmental Damage/Fines • Reduction in Species Recovery Costs • Reduction in Water Treatment Costs • Reduced Effectiveness of Reservoirs • Benefits Realized Sooner
Future Needs • Northern Gulf of Mexico Alliance • Information from: • Galveston District • Charleston District • Buffalo District • “Heartland” District • Honolulu District
Tentative Schedule • Finalizing Framework at RSM Conference (September 2008) • Summarize Findings at RSM Conference (April 2009) • Draft Report (~15 May 2009) • Finalize Report (30 June 2009)