Download
1 / 1
10 likes | 131 Views
Adventures in Computational Thinking By Aurora Lopez CSE 3 Fluency with Information Technology (FIT ). Presentation of Information with MS PowerPoint. Computational Thinking . Visual Programming with Alice.

E N D
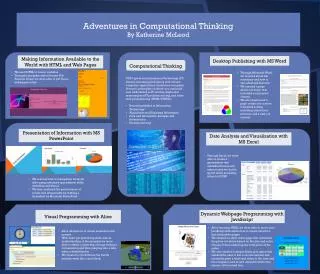
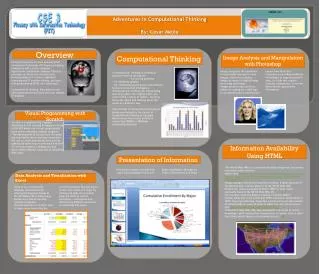
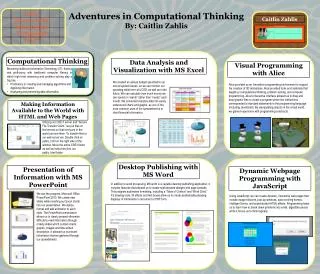
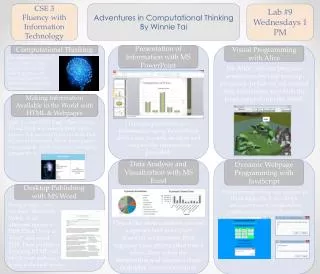
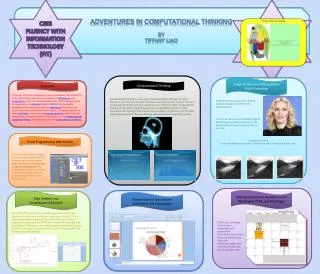
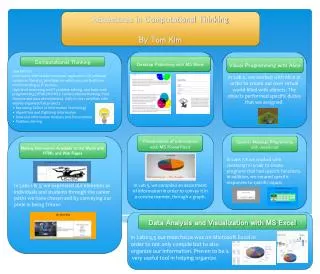
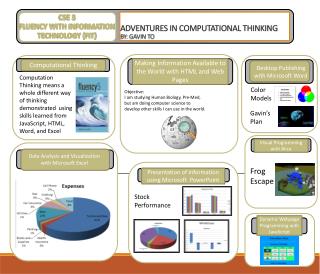
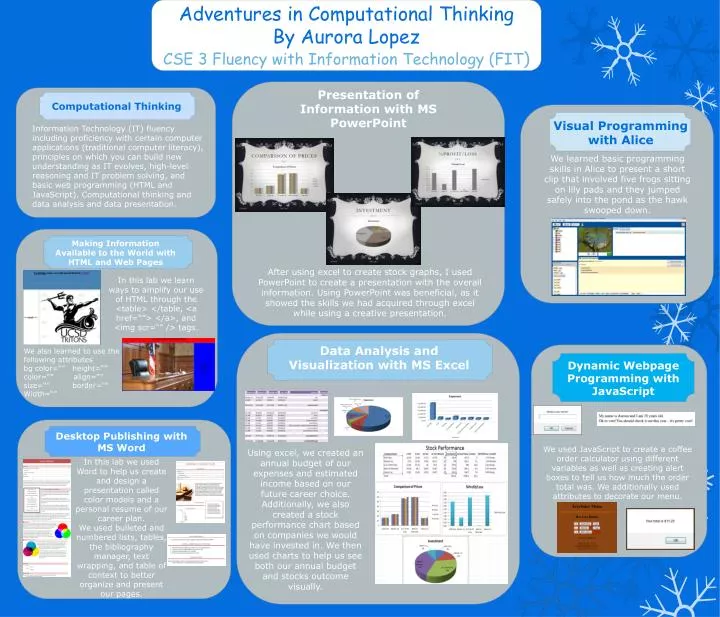
Adventures in Computational Thinking By Aurora Lopez CSE 3 Fluency with Information Technology (FIT) Presentation of Information with MS PowerPoint Computational Thinking Visual Programming with Alice Information Technology (IT) fluency including proficiency with certain computer applications (traditional computer literacy), principles on which you can build new understanding as IT evolves, high-level reasoning and IT problem solving, and basic web programming (HTML and JavaScript). Computational thinking and data analysis and data presentation. We learned basic programming skills in Alice to present a short clip that involved five frogs sitting on lily pads and they jumped safely into the pond as the hawk swooped down. Making Information Available to the World with HTML and Web Pages After using excel to create stock graphs, I used PowerPoint to create a presentation with the overall information. Using PowerPoint was beneficial, as it showed the skills we had acquired through excel while using a creative presentation. In this lab we learn ways to amplify our use of HTML through the <table> </table, <a href=“”> </a>, and <img scr=“” /> tags. Data Analysis and Visualization with MS Excel We also learned to use the following attributes bg color=“” height=“” color=“” align=“” size=“” border=“” Width=“” Dynamic Webpage Programming with JavaScript Desktop Publishing with MS Word We used JavaScript to create a coffee order calculator using different variables as well as creating alert boxes to tell us how much the order total was. We additionally used attributes to decorate our menu. Using excel, we created an annual budget of our expenses and estimated income based on our future career choice. Additionally, we also created a stock performance chart based on companies we would have invested in. We then used charts to help us see both our annual budget and stocks outcome visually. In this lab we used Word to help us create and design a presentation called color models and a personal resume of our career plan. We used bulleted and numbered lists, tables, the bibliography manager, text wrapping, and table of context to better organize and present our pages.