Download
1 / 21
210 likes | 293 Views
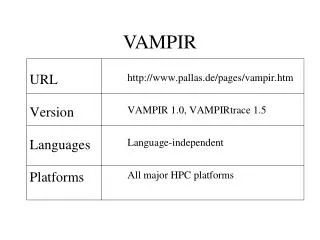
Performance Analysis with Vampir. ZIH, Technische Universität Dresden. Outline. Mission Event Tracing Event Trace Visualization Vampir & VampirServer The Vampir Displays. Mission. Visualization of dynamics of complex parallel processes Requires two components

E N D
Performance Analysis with Vampir ZIH, Technische Universität Dresden
Outline • Mission • Event Tracing • Event Trace Visualization • Vampir & VampirServer • The Vampir Displays
Mission • Visualization of dynamicsof complex parallel processes • Requires two components • Monitor/Collector (Score-P) • Charts/Browser (Vampir) Typical questions that Vampir helps to answer: • What happens in my application execution during a given time in a given process or thread? • How do the communication patterns of my application execute on a real system? • Are there any imbalances in computation, I/O or memory usage and how do they affect the parallel execution of my application?
Event Tracing • Recording information about significant points (events) during execution of the program • Enter / leave of a region (function, loop, …) • Send / receive a message, … • Save information in event record • Timestamp, location, event type • Plus event-specific information (e.g., communicator,sender / receiver, …) • Abstract execution model on level of defined events • Event trace = Chronologically ordered sequence of event records
... 2 1 bar foo ... 60 64 58 ... 68 69 62 B A B A A B EXIT SEND RECV ENTER ENTER EXIT 1 2 2 A B 1 Event Tracing Local trace A ... ... Process A Global trace view 58 60 ENTER ENTER 1 1 void foo() { trc_enter("foo"); ... trc_send(B); send(B, tag, buf); ... trc_exit("foo"); } void foo() { ... send(B, tag, buf); ... } MONITOR 68 62 RECV SEND A B 64 69 EXIT EXIT 1 1 ... ... 1 1 bar foo ... ... instrument Local trace B synchronize(d) Process B merge void bar() { ... recv(A, tag, buf); ... } void bar() { trc_enter("bar"); ... recv(A, tag, buf); trc_recv(A); ... trc_exit("bar"); } unify MONITOR
Event Tracing: Pros & Cons • Tracing advantages • Event traces preserve the temporal and spatial relationships among individual events (context) • Allows reconstruction of dynamic application behaviour on any required level of abstraction • Most general measurement technique • Profile data can be reconstructed from event traces • Disadvantages • Traces can very quickly become extremely large • Writing events to file at runtime causes perturbation • Writing tracing software is complicated • Event buffering, clock synchronization, ...
1 foo 2 bar 3 ... ... 58 A ENTER 1 60 B ENTER 2 62 A SEND B A 64 A EXIT 1 68 B RECV A B 69 B EXIT 2 ... 58 60 62 64 66 68 70 Event Tracing: Time-line Visualization main foo bar
Event Trace Visualization with Vampir • Alternative and supplement to automatic analysis • Show dynamic run-time behavior graphically at any level of detail • Provide statistics and performance metrics Timeline charts • Show application activities and communication along a time axis Summary charts • Provide quantitative results for the currently selected time interval
CPU CPU CPU CPU CPU CPU CPU CPU Multi-Core Program Trace File(OTF2) Vampir – Visualization Modes (1) • Directly on front end or local machine % vampir Score-P Vampir8 Small/Medium sized trace Thread parallel
CPU CPU CPU CPU CPU CPU CPU CPU CPU CPU CPU CPU CPU CPU CPU CPU CPU CPU CPU CPU CPU CPU CPU CPU CPU CPU CPU CPU CPU CPU CPU CPU CPU CPU CPU CPU CPU CPU CPU CPU CPU CPU CPU CPU CPU CPU CPU CPU Trace File (OTF2) VampirServer Many-Core Program Vampir – Visualization Modes (2) • On local machine with remote VampirServer % vampir % vampirserverstart –n 12 Vampir8 Score-P LAN/WAN Large Trace File (stays on remote machine) MPI parallel application
Usage order of the Vampir Performance Analysis Toolset • Instrument your application with Score-P • Run your application with an appropriate test set • Analyze your trace file with Vampir • Small trace files can be analyzed on your local workstation • Start your local Vampir • Load trace file from your local disk • Large trace files should be stored on the HPC file system • Start VampirServer on your HPC system • Start your local Vampir • Connect local Vampir with the VampirServer on the HPC system • Load trace file from the HPC file system
The main displays of Vampir • Timeline Charts: • Master Timeline • Process Timeline • Counter Data Timeline • Performance Radar
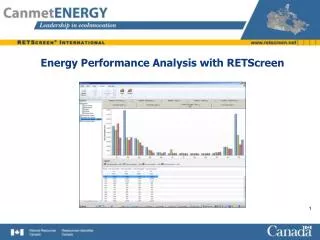
Vampir: Visualization of the NPB-MZ-MPI / BT trace % vampirscorep_bt-mz_B_4x4_trace Navigation Toolbar Function Summary Function Legend Master Timeline
Vampir: Visualization of the NPB-MZ-MPI / BT trace Master Timeline Detailed information about functions, communication and synchronization events for collection of processes.
Vampir: Visualization of the NPB-MZ-MPI / BT trace Process Timeline Detailed information about different levels of function calls in a stacked bar chart for an individual process.
Vampir: Visualization of the NPB-MZ-MPI / BT trace Counter Data Timeline Detailed counter information over time for an individual process.
Vampir: Visualization of the NPB-MZ-MPI / BT trace Performance Radar Detailed counter information over time for a collection of processes.
Vampir: Visualization of the NPB-MZ-MPI / BT trace Zoom in: Computation Phase MPI communication results in lower floating point operations.
Summary • Vampir & VampirServer • Interactive trace visualization and analysis • Intuitive browsing and zooming • Scalable to large trace data sizes (20 TByte) • Scalable to high parallelism (200000 processes) • Vampir for Linux, Windows and Mac OS X • Note: Vampir does neither solve your problems automatically nor point you directly at them. It does, however, give you FULL insight into the execution of your application.
Vampir is available at http://www.vampir.eu, get support via vampirsupport@zih.tu-dresden.de
Acknowledgement Staff at ZIH - TU Dresden: Ronny Brendel, HolgerBrunst, Jens Doleschal, Ronald Geisler, Daniel Hackenberg, Michael Heyde, Matthias Jurenz,Michael Kluge, Andreas Knüpfer, Matthias Lieber, HolgerMickler, HartmutMix, Matthias Weber, Bert Wesarg, Frank Winkler, Matthias Müller, Wolfgang E. Nagel