Download
1 / 26
310 likes | 446 Views
Learn the basics of energy performance analysis, methods for MT&R, Measurement & Verification, using RETScreen software. Understand target setting, data analysis, and efficiency improvement. Explore energy consumption factors, models, and tools for performance analytics.

E N D
Learning Objectives • Review basics of energy performance analysis • Illustrate methods and techniques for Monitoring, Targeting & Reporting (MT&R) • Highlight key concepts of Measurement & Verification (M&V) • Introduce the energy management software tool within RETScreen – the Performance Analysis Module • Understand basic structure of the RETScreen Plus Performance Analysis Module • Be able to use the software to monitor, analyse, and report key energy performance data
Monitoring, Targeting & Reporting (MT&R) • MT&R provides a systematic approach to gaining and maintaining control over energy consumption (or production) through measurement and analysis followed by well-directed actions • The key steps to effective MT&R are: • measurement of energy consumption (or production) over time • measurement of influencing factors (weather, production level, occupancy) over corresponding time intervals • development of a relationship (a model) between energy and the influencing factors • establishment of energy reduction (or production) targets • frequent comparison of actual consumption (or production) with targets • reporting of consumption (or production) and target variances • initiation of actions to ensure targets are met
Measure Result Data Take Action Analyse Information MT&R Feedback Loop
Develop Relationship: Energy & Influencing Factors • How does energy consumption or energy production vary with a factor of influence (i.e. driver, such as weather)? • How does the relationship change with time? Consumption or Production • Fuel consumption • Electricity consumption • Water consumption • Electricity production Factors of influence • Weather • Occupancy • Production level • Solar radiation
Models Predict Energy Consumption or Production • Historical consumption or production • Static, not dynamic with drivers • Statistical model E = Function of drivers • Mathematical relationship between energy consumption (or production) and the “driver” exists • It’s often linear, of the form y = mx + b • Simple linear regression • Multivariable non-linear regression
Establish Energy Reduction (or Production) Targets Reduce Variability Increase Efficiency Reduce Non-Productive Energy (waste) Energy Consumption or Production Driver(s) or Factor(s) of Influence
Typical Tools Used for Energy Performance Analysis “tools that help to identify, understand, quantify and display the relationship between energy and what drives it” • Data visualization (e.g. monthly graphs) • Time series graphs • Regression analysis • Cumulative sum (CUSUM) charts • Targeting • Control charts • Reports
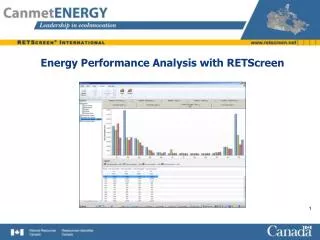
RETScreen Plus Performance Analysis Module • Helps user monitor, analyse, and report key energy performance data to facility operators, managers and senior decision-makers • Energy management software tool • Monitoring, Targeting & Reporting (MT&R) • Measurement & Verification (M&V) • Energy tracking • Integrates near-real-time NASA satellite-derived weather data for entire surface of planet Data Analytics Reporting
Performance Analysis Module - Structure • Start • Project information • Site reference conditions • Data • Step 1 – Consumption/production • Step 2 – Factors of influence • Step 3 – Data processing • Analytics • Step 1 – Baseline • Step 2 – Target • Step 3 – Comparison • Reporting • Step 1 – Report • Step 2 – Edit • Step 3 – Output
Project Example: MT&ROffice Building, Burns Lake, BC, Canada See template Photo Credit: Jeff Ragsdale, Village of Burns Lake
Measurement & Verification (M&V) • A process of quantifying energy consumption (or production) and water consumption before and after an Energy Conservation Measure is implemented to verify and report on the savings actually achieved • International Performance Measurement and Verification Protocol (IPMVP) http://www.evo-world.org
Select IPMVP Option A. Partially Measured Retrofit Isolation • With assumption/stipulations B. Retrofit Isolation • Fully measured C. Whole Facility • Or sub-metered part D. Calibrated Simulation • With software
A. Partially Measured Retrofit Isolation • Instantaneous measurements of lighting power before and periodically after retrofit • Assumptions (stipulations) for operating hours and burnout rates • Calculation of heating interaction from electrical savings & boiler efficiency Example: T12 to T8 lighting retrofit
B. Retrofit Isolation • Three separate test of boiler efficiency were made before and after retrofit • Boiler was effectively isolated by gas meter on the input and heat meter on the output • Savings are reported under base year conditions Example: boiler replacement
C. Whole Facility • Gas & electricity modeled by correlation to heating degree days (HDD) • Adjustments made for new computers • Savings calculated under post retrofit conditions as “avoided costs” Example: multiple energy conservation measures (ECM), operator training & occupant awareness
D. Calibrated Simulation • New electric and steam metered installed • Post retrofit energy use was computed with software calibrated to match readings • Baseline computed from “calibrated model” and base year weather • Savings = baseline - post Example: ECM’s in one non-metered building of a multi-building complex
Project Example: M&VPhotovoltaic Power System, Toronto, ON, Canada See template Photo Credit: Carmanah Solar
Conclusions Implementing an energy monitoring, targeting and reporting (MT&R) system can be a powerful way to better manage energy project investments as well as identify additional project opportunities The RETScreen Plus Performance Analysis Module can be used worldwide to monitor, analyse, and report key energy performance data to facility operators, managers and senior decision-makers A Data worksheet enables the user to create, import, calculate, filter, merge and store various datasets needed to prepare an analysis An Analytics worksheet helps the user establish a baseline for the project, predict the energy consumption or production of a facility using regression analysis, set a target and then track the energy performance of an ongoing basis The Reporting worksheet allows the user to create, edit and output various datasets and figures needed to properly present the analysis of the project The measurement and verification (M&V) of actual savings (or production) achieved by a clean energy project is an important final step in the energy decision chain
Questions? www.RETScreen.net