Download
1 / 14
140 likes | 272 Views
Common Core State Standards for Mathematics. Making Inferences and Justifying Conclusions S-IC Math.S-IC.5. Use data from a randomized experiment to compare two treatments; use simulations to decide if differences between parameters* are significant.

E N D
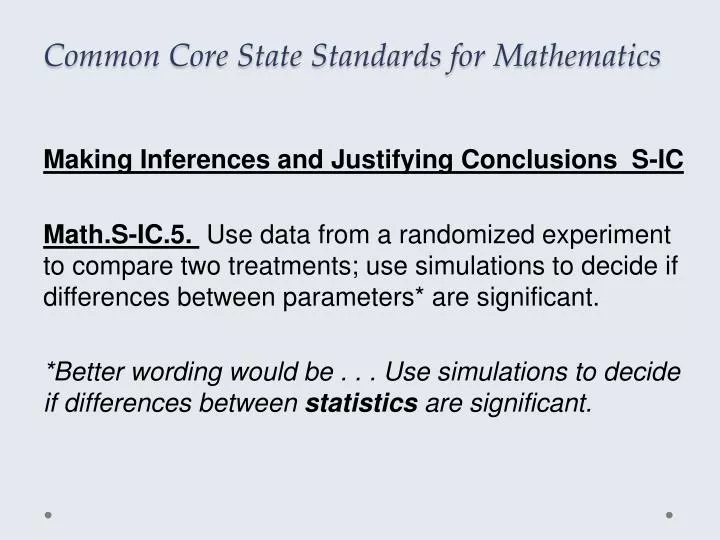
Common Core State Standards for Mathematics Making Inferences and Justifying Conclusions S-IC Math.S-IC.5. Use data from a randomized experiment to compare two treatments; use simulations to decide if differences between parameters* are significant. *Better wording would be . . . Use simulations to decide if differences between statistics are significant.
Common Core State Standards for Mathematics Interpreting Categorical and Quantitative Data S-ID Math.S-ID.1. Represent data with plots on the real number line (dot plots, histograms, and box plots). Math.S-ID.2. Use statistics appropriate to the shape of the data distribution to compare center (median, mean) and spread (interquartile range, standard deviation) of two or more data sets. Math.S-ID.3 Interpret differences in shape, center, and spread in the context of the data sets, accounting for possible effects of extreme data points (outliers).
Common Core State Standards for Mathematics Making Inferences and Justifying Conclusions S-IC Math.S-IC.2. Decide if a specified model is consistent with results from a given data-generating process, e.g., using simulation. Math.S-IC.3 Recognize the purposes of and differences among sample surveys, experiments, and observational studies; explain how randomization relates to each.
Nature Neuroscience 3, 1237 – 1238 (2000) Visual discrimination learning requires sleep after training Robert Stickgold, LaTanya James, & J. Allan Hobson Laboratory of Nerophysiology, Department of Psychiatry, Harvard Medical School “Performance on a visual discrimination task showed maximal improvement 48-96 hours after initial training, even without intervening practice. When subjects were deprived of sleep for 30 hours after training and then tested after two full nights of recovery sleep, they showed no significant improvement, despite normal levels of alertness.”
Subjects were randomly assigned to one of two groups (sleep deprivation the first night or unrestricted sleep the first night). Subjects whose scores after initial training were excessively high or low were excluded from the analysis. Change in performance from original test to retest 72 hours later measured in milliseconds: Unrestricted sleep group (n = 10): Sleep deprivation group (n = 11):
With a partner, work and discuss problems 1 through 5 on student handout.
Experiment vs. observational study • Treatments • Graph for comparing improvements • Summary statistics • What to you think?
What if there really is no negative effect of sleep deprivation on visual discrimination learning? If that were true, might a difference in means as large as 15.92ms occur just by chance when the 21 individuals are randomly split into two groups of 10 and 11? If so, how likely would it be for random assignment to produce a difference that is as large (or larger) than the one obtained in this experiment? We will investigate these questions by randomly assigning the 21 subjects to two groups and analyzing results. We will use both a hands-on activity and a computer applet.
Refer to the student activity on the Sleep Deprivation handout. Participants will work in pairs to perform several randomizations and calculate the difference in sample means. Then we will pool group results and consider answers to questions 6 though 9.
Rossman Chance Applet simulation Once students understand what they want to find out, technology can be used to do hundreds of randomizations very quickly! Consider answers to questions 12 through 14. FYI . . . According to Beth and Alan, when all possible randomizations are considered, the probability of getting a difference in means as high or higher as the one found in this study is 2533/352716 = 0.0072.
Math.S-IC.3 Recognize the purposes of and differences among sample surveys, experiments, and observational studies; explain how randomization relates to each.
Math.S-IC.3 Recognize the purposes of and differences among sample surveys, experiments, and observational studies; explain how randomization relates to each. Thanks to Daren Starnes for sharing his adaptation.
Questions or Comments? Barrett818@gmail.com