Download

1 / 63
630 likes | 743 Views
Network-based analysis of functional genomics data. Jianhua Ruan, PhD Computer Science Department University of Texas at San Antonio http://www.cs.utsa.edu/~jruan. Final project. Final Project Report due Sat, Dec 15 Presentations: Mon, Dec 17, 8-10:30 pm 10 teams to present

E N D
Network-based analysis of functional genomics data Jianhua Ruan, PhD Computer Science Department University of Texas at San Antonio http://www.cs.utsa.edu/~jruan
Final project • Final Project Report due Sat, Dec 15 • Presentations: Mon, Dec 17, 8-10:30 pm • 10 teams to present • Each team will have up to 13 minutes. (10 min presentation, 3 min questions) • Since time is limited, you don’t need to cover all the details in your presentation. • Focus on the most important concepts • More details in your project report
Human: ~22,000 genes Dog: ~20,000 genes Rice: ~35,000 genes Mouse: ~22,000 genes C. Elegans: ~20,000 genes It is not just the genes, but the networks!
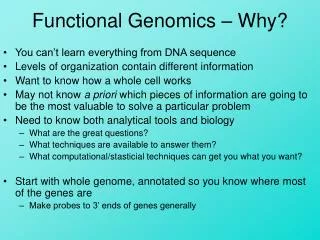
Why networks? • For complex systems, the actual output may not be predictable by looking at only individual components: • The whole is greater than the sum of its parts • Studying genes/proteins on the network level allows us to: • Assess the role of individual genes/proteins in the overall pathway • Evaluate redundancy of network components • Identify candidate genes involved in genetic diseases • Sets up the framework for mathematical models
Graph model of biological networks • An abstract of the complex relationships among molecules in the cell • Vertex: molecule • Gene, protein, metabolite, DNA, RNA • Edges: relationships • Physical interaction • Functional association • Share many common statistical properties with real-world networks • Small-world • Scale-free • Hierarchical • Modular (community structure) (Jeong et al., 2001)
Network analysis algorithms Genetic network reverse-engineering Data Mining, tree models, DNA motif finding Community discovery Network-based disease studies Research Overview Data integration, classification, graph algorithms
Agenda • Community discovery in biological networks • Network-based analysis of microarray data • Network-based biomarker discovery for metastatic breast cancer • Conclusions
Network communities • Communities • Are relatively densely connected sub-networks (modules) • Appear in many types of networks • Independently studied in many fields: • Social science, Computer science, Physics, Biology, etc. • Significance • Biological systems are modular • Metabolic pathways • Protein complexes • Transcriptional regulatory modules • Biological systems are large and complex • Communities provide a high-level overview of the networks • Guilt-by-association • Predict gene functions based on community memberships
Community discovery problem • Divide a network into relatively densely connected sub-networks • Similar to clustering, but # of clusters is determined automatically Vertex reorder
Modularity function (Q) • Measure strength of community structures • Newman, Phy Rev E, 2003 e11 e22 e33 e44 e55
Q = 0.45 Q = 0 Q = 0.40 Q = 0.56 Q = 0.54 Modularity automatically determines # of communities!
Methods for community discovery • Previous methods • Fast but inaccurate (CNM, Phy Rev E, 2004) • Accurate but slow (Guimera&Amaral, Nature 2005) • Relatively accurate, relatively fast (Ruan&Zhang, AAAI 2006, ICDM2007) • Relatively accurate, fast, memory intensive (Newman, PNAS 2006) • Our new algorithm: Qcut/HQcut (Ruan&Zhang, Phys Rev E 2008) • Accurate, fast and memory friendly • HQcut solves the resolution limit of Q
Our method Accuracy Newman’s Inter-community edge probability Algorithm Qcut • Recursive multi-way partitioning until Q is max • Improve Q by efficient heuristic search eig kmeans
Resolution limit and HQcut • Q is known to have a resolution limit problem • Cannot detect small communities • Q slight decreases if forced to split • HQcut solves this problem • Apply Qcut to get communities with largest Q • Recursively search for sub-communities within each community without dramatic change to Q • Statistical test for termination criteria Ruan & Zhang, Physical Review E 2008
Application: protein complex prediction • Input: a yeast PPI network • Data from Krogan et.al., Nature. 2006;440:637-43 • 2708 vertices (proteins), 7123 interactions • 289 communities • Sizes range from 2 to 49 • Evaluation: compare communities with known complexes manually curated in MIPS database
Small ribosomal subunit (90%) RNA poly II mediator (83%) Proteasome core (90%) gamma-tubulin (77%) Exosome (94%) respiratory chain complex IV (82%) Communities in a yeast PPI network
Communities vs. complexes • Communities and complexes have good one to one correspondence • Overall accuracy: 0.81 • Newman: 0.58 Predicted complex Known complex Agreement between a predicted complex (P) and a known complex (K) = |P∩K| / sqrt(|P| x |K|).
Work-in-progress: Random walk-based improvement • Motivation: • PPI network often contain both false positive and false negative edges • Hub genes prevent good partitioning • Three goals: • Eliminate false positive edges • Predict missing links • Reduce the impact of hub genes • Intuition: • Two proteins with high topological similarity, regardless of connected or not, may belong to same complex • Two proteins with direct link but very different topological properties may belong to different complexes
Method overview Original network Initial prob vectors Equilibrium prob vectors Random walk with resistance Distance calculation = New network Adjacency matrix Similarity matrix threshold (guided by topology)
Preliminary results on yeast PPI • Predicted PPIs have much higher functional relevance than removed PPIs, using several sources of evidence • Gene Ontology • Gene expression • etc. • New network significantly improved accuracy of protein complex predictions • Using HQcut: 0.50 to 0.55 • Using MCL: 0.48 to 0.59
Agenda • Community structure in biological networks • Prediction of protein complexes • Network-based microarray data analysis • Network-based biomarker discovery for metastatic breast cancer • Conclusions
Microarray data analysis • Gene network structure is unknown • Microarray measures gene expression (activity) level • Clustering is the most common analysis tool • Many clustering algorithms available • K-means • Hierarchical • Self organizing maps • Parameter (e.g., k) hard to guess • Does not consider network structure Conditions Clustering genes • Common functions? • Common regulation? • Predict functions for unknown genes?
Network-based microarray data analysis Sample • Genes i and j connected if their expression patterns are “sufficiently similar” • Pearson correlation coefficient > arbitrary threshold • K nearest neighbors (KNN) • Key: how to get the “best” network? Construct Co-expression network i j = Gene
Motivation • Can we use the idea of community discovery for clustering microarray data? • Advantages: • Parameter free • Network topology considered • Constructed network may have other interesting applications beyond clustering
Our idea Ruan, ICDM 2009 Network series • Intuition: the real network is naturally modular • Can be measured by modularity (Q) • If constructed right, should have the highest Q Microarray data Similarity matrix Qcut Net_1, Most dense …… Net_m, Most sparse Qcut
Our idea (cont’d) True network Random network Modularity Difference Network density • Therefore, use ∆Q to determine the best network parameter and obtain the best community structure
Results: synthetic data set 1 • High dimensional data generated by synDeca. • 20 clusters of high dimensional points, plus some scatter points • Clusters are of various shapes: eclipse, rectangle, random Accuracy ∆Q
Comparison mKNN-HQcut with the optimum k mKNN-HQcut with automatically determined k K-means
Results: synthetic data set 2 • Gene expression data • Thalamuthu et al, 2006 • 600 data sets • ~600 genes, 50 conditions, 15 clusters • 0 or 1x outliers Without outliers With outliers mKNN-HQcut With optimal k mKNN-HQcut With auto k
Comparison with other methods Ruan et al., BioKDD 2010
Results on yeast stress response data • 3000 genes, 173 samples Best k = 140. Resulting in 75 clusters
Results on yeast stress response data • Enrichment of common functions • Accumulative hyper-geometric test (Fisher’s exact test) Protein biosynthesis (p < 10-96) Peroxisome (p < 10-13) Nuclear transport (p < 10-50) Gene mt ribosome (p < 10-63) DNA repair (p < 10-66) RNA splicing (p < 10-105) Nitrogen compound metabolism (p < 10-37) GO Function Terms
Comparison with k-means Using automatically determined k = 140 mkNN-HQcut K-means Overall enrichment score
An interesting community • A 25-gene community missed by other methods 4 telomere maintenance genes (p < 10-7) 16 unknown genes, all located in chromosome telomeric regions 5 other genes at rim of the sub-network 4 transcription factors regulate many genes in the community
Application to Arabidopsis data • ~22000 genes, 1138 samples • 1150 singletons • 800 (300) modules of size >= 10 (20) • > 80% (90%) of modules have enriched functions • Much more significant than all five existing studies on the same data set Top 40 most significant modules
Cis-regulatory network of Arabidopsis Motif Module Ruan et al., BMC Bioinfo, to appear
Beyond gene clustering (1) • Gene specific studies • Collaborator is interested in Gibberellins • A hormone important for the growth and development of plant • Commercially important • Biosynthesis and signaling well studied • Transcriptional regulation of biosynthesis and signaling not yet clear • 3 important gene families, GA20ox, GA3ox and GA2ox for biosynthesis • Receptor gene family: GID1A,B,C • Analyze the co-expression network around these genes
20ox GID1C GID1A 3ox GA3 20ox5 GID1B 2ox 2ox6 2ox4 2ox8 2ox2 20ox1 3ox2 3ox4 3ox3 2ox3 20ox3 20ox4 2ox7 20ox2 3ox1 2ox1
Beyond gene clusters (2) Sample • Cancer classification Sample: patient or cell lines Sample Qcut Gene Alizadeh et. al. Nature, 2000
Network of cell samples Shape: cell line / cancer type Color: clustering results Transformed cell lines Activated Blood B Follicular lymphoma (FL) DLBCL DLBCL Resting Blood B Blood T Diffuse large B-cell Lymphoma (DLBCL) Chronic lymphocytic leukemia (CLL)
Survival rate after chemotherapy Survival rate: 40% Median survival time: 22.3 months Survival rate: 73% Median survival time: 71.3 months DLBCL-2 DLBCL-1 DLBCL-3 Survival rate: 20% Median survival time: 12.5 months
Beyond gene clustering (3) • Topology vs function % of essential proteins Number of connections Jeong et. al. Nature 2001
Community participation vs. essentiality (PPI) Hub % Essential Non-hub Community participation
Community participation vs. essentiality (coexp) • Key: how to systematically search for such relationships? • Data mining – association rule? Hub Participation < 0.2 % Essential % Essential Non-hub Participation >= 0.2 Number of connections Community participation
Agenda • Community structure in biological networks • Prediction of protein complexes • Network-based microarray data analysis • Network-based biomarker discovery for metastatic breast cancer • Conclusions
Background Metastasis is the spread of cancer from one organ to another non-adjacent organ or part. Challenge: Predict Metastasis If metastasis is likely => aggressive adjuvant therapy How to decide the likelihood? Traditional predictive factors are not goodenough
Microarray-based marker discovery Examine genome-wide expression profiles Idea: Score individual genes for how well they discriminate between different classes of disease Establish gene expression signature Limitations: # genes >> # patients Downstream effects Individual variations not attributed to cancer Consequences: Low reproducibility acrossdata sets Missing biological insight M N