Download
1 / 43
430 likes | 537 Views
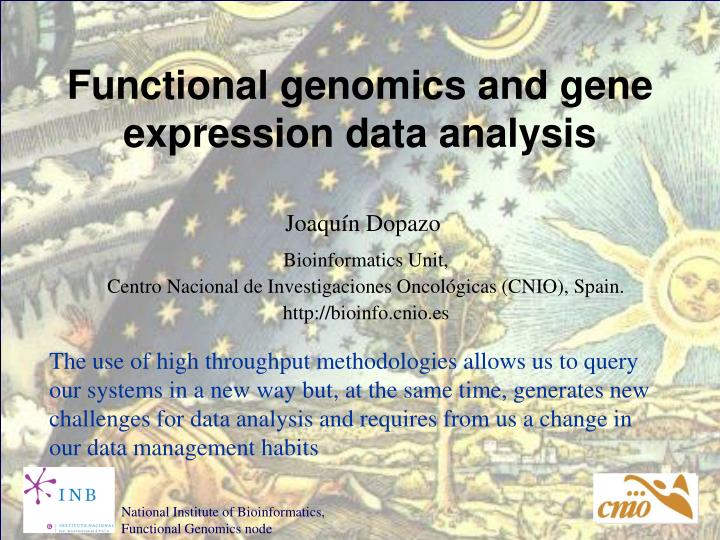
Functional genomics and gene expression data analysis. J oaquín Dopazo. Bioinformatics Unit, Centro Nacional de Investigaciones Oncológicas (CNIO), Spain. http://bioinfo.cnio.es.

E N D
Functional genomics and gene expression data analysis Joaquín Dopazo Bioinformatics Unit, Centro Nacional de Investigaciones Oncológicas (CNIO), Spain. http://bioinfo.cnio.es The use of high throughput methodologies allows us to query our systems in a new way but, at the same time, generates new challenges for data analysis and requires from us a change in our data management habits National Institute of Bioinformatics, Functional Genomics node
Now: 23531(NCBI 34 assembly 02/04) Recent estimations: 20.000 to 100.000. 50% mRNAs do not code for proteins (mouse) 50% display alternative splicing Genes in the DNA... …whose final effect can be different because of the variability. 25%-60% unknown >protein kinase acctgttgatggcgacagggactgtatgctgatctatgctgatgcatgcatgctgactactgatgtgggggctattgacttgatgtctatc.... …are expressed and constitute the transcriptome... More than 4 millon SNPs have been mapped From genotype to phenotype. (only the genetic component) A typical tissue is expressing among 5000 and 10000 genes …conforming complex interaction networks (metabolome)... … which accounts for the functionproviding they are expressed in the proper moment and place... …in cooperation with other proteins (interactome) … ...and code for proteins (proteome) that... Each protein has an average of 8 interactions
Pre-genomics scenario in the lab >protein kunase acctgttgatggcgacagggactgtatgctgatctatgctgatgcatgcatgctgactactgatgtgggggctattgacttgatgtctatc....
Phylogenetic tree Molecular databases Search results Information Motif databases alignment Motif Conserved region Secondary and tertiary protein structure Bioinformatics tools for pre-genomicsequence data analysis Sequence The aim: Extracting as much information as possible for one single data
SNPs Expression Arrays http://www.ncbi.nlm.nih.gov/Genbank/genbankstats.html Post-genomic vision Who? Genome sequencing Literature, databases 2-hybrid systems Mass spectrometry for protein complexes What do we know? And who else? In what way? Where, when and how much?
polimorphisms Gene expression Post-genomic vision genes Information The new tools: Clustering Feature selection Data integration Information mining Information Databases interactions
Gene expression profiling.The rationale, what we would like and related problems • Differences at phenotype level are the visible cause of differences at molecular level which, in many cases, can be detected by measuring the levels of gene expression. The same holds for different experiments, treatments, etc. • Classification of phenotypes / experiments (Can I distinguish among classes, values of variables, etc. using molecular gene expression data?) • Selection of differentially expressed genes among the phenotypes / experiments (did I select the relevant genes, all the relevant genes and nothing but the relevant genes?) • Biological roles the genes are playing in the cell (what general biological roles are really represented in the set of relevant genes?)
Question Experiment test Experiment (sometimes) test Question Is there any gene (or set of genes) involved in any process? A note of caution: Genome-wide technologies allows us to produce vast amounts of data. But... data is not knowledgeMisunderstanding of this has lead to “new” (not necessarily good) ways of asking (scientific) questions Is gene A involved in process B?
Gene expression analysis using DNA microarrays There are two dominant technologies: spotted arrays and oligo arrays although new players are arriving to the arena Cy5 Cy3 cDNA arrays Oligonucleotide arrays
Transforming images into data Test sample labeled red (Cy5) Reference sample labeled green (Cy3) Red : gene overexpressed in test sample Green : gene underexpressed in test sample Yellow - equally expressed red/green - ratio of expression
Normalisation A There are many sources of error that can affect and seriously biass the interpretation of the results. Differences in the efficience of labeling, the hibridisation, local effects, etc. Normalisation is a necessary step before proceeding with the analysis B C Before (left) and after (right) normalization. A) BoxPlots, B) BoxPlots of subarrays and C) MA plots (ratio versus intensity) (a) After normalization by average (b) after print-tip lowess normalization (c) after normalization taking into account spatial effects
The data ... A B C Different classes of experimental conditions, e.g. Cancer types, tissues, drug treatments, time survival, etc. • Characteristics of the data: • Many more variables (genes) than measurements (experiments / arrays) • Low signal to noise ratio • High redundancy and intra-gene correlations • Most of the genes are not informative with respect to the trait we are studying (account forunrelated physiological conditions, etc.) • Many genes have no annotation!! Expression profile of all the genes for a experimental condition (array) Genes (thousands) Expression profile of a gene across the experimental conditions Experimental conditions (from tens up to no more than a few houndreds)
Multiple array experiments. Can we find groups of experiments with similar gene expression profiles? Unsupervised Different phenotypes... Supervised Reverse engineering What genes are responsible for? Molecular classification of samples What do they have in common? Co-expressing genes... B C A How is the network? D Genes interacting in a network (A,B,C..)... E
Non hierarchical hierarchical K-means, PCA UPGMA quick and robust SOM SOTA Different levels of information Unsupervised clustering methods:Useful for class discovery (we do not have any a priori knowledge on classes)
An unsupervised problem: clustering of genes. • Gene clusters are unknown beforehand • Distance function • Cluster gene expression patterns based uniquely on their similarities. • Results are subjected to further interpretation (if possible)
Clustering of experiments:The rationale If enough genes have their expression levels altered in the different experiments, we might be able of finding these classes by comparing gene expression profiles. Distinctive gene expression patterns in human mammary epithelial cells and breast cancers Overview of the combined in vitro and breast tissue specimencluster diagram. A scaled-down representation of the 1,247-gene clusterdiagram The black bars show the positions of theclusters discussed in the text: (A) proliferation-associated, (B) IFNregulated,(C) B lymphocytes, and (D) stromal cells. Perou et al., PNAS 96 (1999)
Clustering of experiments:The problems Any gene (regardeless its relevance for the classification) has the same weight in the comparison. If relevant genes are not in overwhelming majority it produces: Noise and/or irrelevant trends
Supervised analysis.If we already have information on the classes, our question to the data should use it.Class prediction based on gene expression profiles: A B C Problems: How can classes A, B, C... be distiguished based on the corresponding profiles of gene expression? How a continuous phenotypic trait (resistence to drugs, survival, etc.) can be predicted? And Which genes among the thousands analysed are relevant for the classification? Predictor Genes (thousands) Gene selection Experimental conditions (from tens up to no more than a few houndreds)
Gene selection.We are interested in selecting those genes showing differential expression among the classes studied. • Contingency table (Fisher's test) • For discrete data (presence/absence, etc). • T-test • We could compare gene expression data between two types of patients. • ANOVA • Analysis of variance. We compare between two or more groups the value of an interval data. The pomelo tool
Gene selection and class discrimination 10 10 cases controls Genes differentially expressed among classes (t-test or ANOVA), with p-value < 0.05
Sorry... the data was a collection of random numbers labelled for two classes This is a multiple-testing statistic contrast. Adjusted p-values must be used!
NE EEC Gene selection between normal endometrium (ne) and endometrioid endometrial carcinomas (eec) NE EEC G Symbol A Number Hierarchical Clusteringof 86 genes with different expression patterns between Normal Endometrium andEndometrioid Endometrial Carcinoma (p<0.05) selected among the ~7000 genes in the CNIO oncochip Moreno et al., BREAST AND GYNAECOLOGICAL CANCER LABORATORY, Molecular Pathology Programme, CNIO
And, genes are not only related to discrete classes... • Pomelo: a tool for finding differentially expressed genes • Among classes • Survival • Related to a continuous parameter
Of predictors and molecular signatures A B 1 Training (with internal and/or external CV) Model, or classificator A/B? Unknown sample A CV 2. Classification / prediction A/B?
Predictor of clinical outcome in breast cancer Genes are arranged to their correlation eith the pronostic groups Pronostic classifier with optimal accuracy van’t Veer et al., Nature, 2002
What are these groups? Cell cycle... DBs Information Information mining Information mining How are structured? What is this gen? My data... ? Clustering Links
Information mining applications.1) use of biological information as a validation criteria Information mining of DNA array data. Allows quick assignation of function, biological role and subcellular location to groups of genes. Used to understand why genes differ in their expression between two different conditions Sources of information: • Free text • Curated terms (ontologies, etc.)
Gene OntologyCONSORTIUMhttp://www.geneontology.org • The objective of GO is to provide controlled vocabularies for the description of the molecular function, biological process and cellular component of gene products. • These terms are to be used as attributes of gene products by collaborating databases, facilitating uniform queries across them. • The controlled vocabularies of terms are structured to allow both attribution and querying to be at different levels of granularity.
FatiGO: GO-driven data analysisThe aim: to develop a statistical framework able to deal with multiple-testing questions GO: source of information. A reduced number of curated terms The Gene Ontology Consortium. 2000. Gene Ontology: tool for the unification of biology. Nature Genetics25: 25-29
How does FatiGO work? • Compares two sets of genes (query and reference) • Has Ontology information [Process, Function and Component] on different organisms • Select level [2-5]. Important: annotations are upgraded to the level chosen. This increases the power of the test: there are less terms to be tested and more genes by term. Remove genes repeated in Cluster Query Distribution Of GO Terms In Query Cluster Cluster Genes Query Clean Cluster Query GO – DB p-value multiple test Remove genes repeated between Clusters Search GO term at level and ontology selected Distribution Of GO Terms In Reference Cluster Cluster Genes Reference Clean Cluster Reference Remove genes repeated in Cluster Reference Important: since we are performing as many tests as GO terms, multiple-testing adjustment must be used
FatiGO Results The application extracts biological relevant terms (showing a significant differential distribution) for a set of genes Number Genes with GO Term at level and ontology selected for each Cluster Unadjusted p-value Step-down min p adjusted p-value FDR (indep.) adjusted p-value FDR (arbitrary depend.) adjusted p-value Tables GO Term – Genes Genes of old versions (Unigene) Genes without result Repeated Genes GO Tree with diferent levels of information
C PTL LB Understanding why genes differ in their expression between two different phenotypes Limphomas from mature lymphocytes (LB) and precursor T-lymphocyte (PTL). Genes differentially expressed, selected among the ~7000 genes in the CNIO oncochip Genes differentially expressed among both groups were mainly related to immune response (activated in mature lymphocytes) Martinez et al., Human Genetics Laboratory. Molecular Pathology Programme, CNIO
Biological processes shown by the genes differentially expressed among PTL-LB Martinez et al., Human Genetics Laboratory. Molecular Pathology Programme, CNIO
Hundred of differentially expressed genes Panic Bonferroni FWER Hardly a few differentially expressed genes (or even none) Looking for significant differences.Statistical approaches Don’t worry, be happy 2-fold increase/decrease Individual test
Looking for more heuristic and/or realistic ways of finding differentially expressed genes Use of external information • Use of biological information as a validation criteria • Use of biological information as part of the algorithm False Discovery Rate (FDR), controls the expected number of false rejections among the rejected hypotheses (differentially expressed genes), instead of the more conservative FWER, that controls the probability that one of more of the rejected hypotheses is true. Necessity of a tool and the appropriate statistical framework for the management of the information
A B B A Metabolism Transport ... Reproduction Use biological information as a validation criteria Applications2) Use of biological information as a threshold criteria The problem: We might be interested in understanding,e.g., which genes differ between tissues, diseases, etc. Typically: We examine each gene selecting onlythose that show significant differences usingan appropriate statistical model, andcorrecting for multiple testing. The threshold, thus, is based on expression values in absence of any other information. Conventionallevels (e.g., Type I error rate of 0.05)attending exclusively to statistical criteria are used.
Use of biological information as a threshold criteria Information-driven approach We examine the GO terms associated to each gene and see, correcting for multiple testing, if some of them are overrepresented The thresholdis based on levels (e.g., Type I error rate of 0.05) of distribution of GO terms GO terms A B B A The rationale: genes are differentially expressed because some biological reason Present Absent Metabolism Transport ... Reproduction The procedure becomes more sensitive
Comparing genes differentially expressed between organs testis kidney Díaz-Uriarte et al., CAMDA 02
Other approaches that include information in the algorithm: GSEA Figure 1: Schematic overview of GSEA.The goal of GSEA is to determine whether any a priori defined gene sets (step 1) are enriched at the top of a list of genes ordered on the basis of expression difference between two classes (for example, highly expressed in individuals with NGT versus those with DM2). Genes R1,...RN are ordered on the basis of expression difference (step 2) using an appropriate difference measure (for example, SNR). To determine whether the members of a gene set S are enriched at the top of this list (step 3), a Kolmogorov-Smirnov (K-S) running sum statistic is computed: beginning with the top-ranking gene, the running sum increases when a gene annotated to be a member of gene set S is encountered and decreases otherwise. The ES for a single gene set is defined as the greatest positive deviation of the running sum across all N genes. When many members of S appear at the top of the list, ES is high. The ES is computed for every gene set using actual data, and the MES achieved is recorded (step 4). To determine whether one or more of the gene sets are enriched in one diagnostic class relative to the other (step 5), the entire procedure (steps 2–4) is repeated 1,000 times, using permuted diagnostic assignments and building a histogram of the maximum ES achieved by any pathway in a given permutation. The MES achieved using the actual data is then compared to this histogram (step 6, red arrow), providing us with a global P value for assessing whether any gene set is associated with the diagnostic categorization. Mootha et al., Nat Genet. 2003 Jul;34(3):267-73
ISW applied to a dataset for which no genes differentially expressed could be found ISW detects 5 pathways arrangement Pathways over- and underrepresented Mootha et al., Nat Genet. 2003 17 NTG vs. 8 IGT 18 DM2 No differentially expressed genes between both conditions were found. Gene Set Enrichment Analysis detects Oxidative phosphorylation Normal tolerance to glucose IGT + Diabetic
Scanning, Image processing External tools EP, HAPI In silico CGH Array Normalization DNMAD Two-conditions comparison Gene selection Two-classes Multiple classes Continuous variable Categorical variable survival Unsupervised clustering Hierarchical SOM SOTA SomTree Preprocessor+ hub Predictor tnasas Supervised clustering SVM Viewers SOTATree TreeView SOMplot Datamining FatiGO FatiWise Algorithms are used if they are available in programs.GEPAS, a package for DNA array data analysis
A G E F B C D
Bioinformatics Group, CNIO From left to right: Lucía Conde, Joaquín Dopazo,Alvaro Mateos, Fátima Al-Shahrour, Víctor Calzado, Hernán Dopazo, Javier Herrero, Javier Santoyo, Ramón Díaz, Michal Karzinstky & Juanma Vaquerizas http://gepas.bioinfo.cnio.es http://fatigo.bioinfo.cnio.es http://bioinfo.cnio.es