Download
1 / 44
440 likes | 506 Views
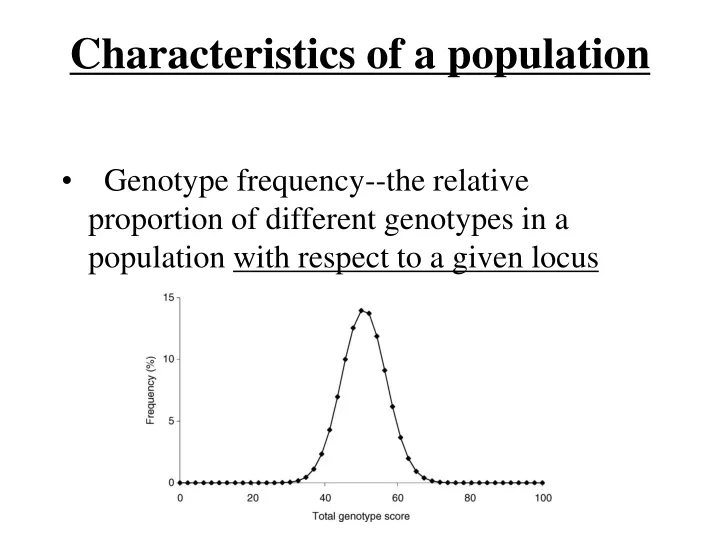
Characteristics of a population. Genotype frequency--the relative proportion of different genotypes in a population with respect to a given locus. Genotype Frequencies Define the Population. For example, consider the A_ locus

E N D
Characteristics of a population • Genotype frequency--the relative proportion of different genotypes in a population with respect to a given locus
Genotype Frequencies Define the Population • For example, consider the A_ locus • We can define a population in terms of the frequencies of the AA, Aa, and aa genotypes. (We often illustrate these concepts with just one locus, since for 2 alleles per locus, there are 3n possible genotypes--when n=5, there are 243 genotypes).
Gene Frequencies Also Define the Population • economy--there are many more genotypes than genes (see previous slide) • gene is the stable unit of inheritance--genes, rather than genotypes, are transmitted from parents to progeny
Gene Frequencies • a change in gene frequency is the goal of selection. This is the goal of the breeder, and one of the ways in which we measure progress from selection.
Estimating Gene Frequencies Calculate directly from the number of genes: 130 A alleles/200 =0.65 70 a alleles/200 = 0.35
Estimating Gene Frequencies 2. Estimate from genotype frequencies p1(A)= .5 + .5(.3)=0.65 p2(a)= .2 + .5(.3)=0.35 or p2=1- 0.65 = 0.35, since p1+ p2=1.0
Factors affecting gene frequency 1. Population size 2. Migration 3. Mutation 4. Selection 5. Mating system--progeny genotypes constituted by union of gametes in parental generation
Hardy-Weinberg • In 1908 British mathematician Hardy and German physician Weinberg showed independently that: • For any gene frequency, the following holds true in a large random mating population in the absence of factors which affect gene frequency:
Hardy-Weinberg • Given locus A_ in which the frequency of A is p1 and the frequency of a is p2, after 1 cycle of random mating, the genotype frequencies of the progeny will be: • P12AA : 2p1p2Aa : p22aa
Hardy-Weinberg Equilibrium 1. Large RM population will reach an equilibrium with respect to gene and genotypic frequencies after only one cycle of RM, regardless of gene freq. in parents. 2. Genotype frequencies of progeny determined solely by gene frequencies of parents.
Hardy-Weinberg Equilibrium 3. In the absence of mutation, migration, selection, and drift, this equilibrium will persist.
HW: Does it Matter to the Plant Breeder? • All selection theory that is the underpinning of plant breeding based on HW populations • One classic example of an HW population is the Aztec farmer’s field of maize • The other classic example of an HW pop is the F2 generation of a self pollinated crop like wheat or soybean
HW- The OP Maize Field • Each plant has the opportunity to mate with any other plant • OP varieties were commonly grown before hybrids took hold • OP landraces are still common in developing countries
The F2 Generation has Hardy-Weinberg Frequencies • This is harder to grasp, but look at the genotypes and their frequencies in the F2 The frequency of the A and the a alleles is 0.5 The genotype frequencies in the F2 are exactly HW
Departure from HW • Once we begin to inbreed (non random mating) or select (change gene frequency) we disrupt HW equilibrium • But it is useful to know that each breeding population starts off in HW equilibrium
Designation of Inbred Lines The commonly used systems for describing the generations that follow the mating of two parents are the “F” and “S” systems. F refers to Filial, and is most commonly used with self pollinated species and S refers to generations of selfing and is used with cross pollinated species. We will use the F system almost exclusively in this course, but you should be aware of the equivalence of the two systems:
Designation of Inbred Lines One of the conventions we will use in this course is the 2 tier system described by Fehr (p. 31-32) in which a line is designated as follows: Fx:y in which x is the generation of derivation and y is the current generation. Why is this important? Because there is considerable difference between an F2-derived line in the F6 and an F4-derived line in the F6, yet both could be classified as ‘an F6 line’. So if we write F2:4, we are referring to a line that is now in the F4 generation, which came about (was derived) when we harvested a head in the F2 generation.
Segregation at the A_Locus Under Self Pollination The frequency of heterozygotes is estimated by (1/2)G, where G is the number of generations of selfing, i.e., F2 = (1/2)1 = 1/2; F3 = (1/2)2 = 1/4; F4 = (1/2)3 = 1/8.
F2 – F8 Generations are Critical • If you understand the next two slides, you will have mastered a critical component of plant breeding • So Pay Attention!
F2:6 vs F4:6 : What are the practical consequences? • Note that in the F4:6 lines 876 of 1000 lines are descendents of homozygous F2 plants • Contrast that with F2:6 lines, where only 500 of 1000 lines are descendents of homozygous F2 plants
F2:6 vs F4:6 : What are the practical consequences? • When you walk the F2:6 lines, you find much more heterogeneity within a line • Concern: will performance be repeatable?
Alleviate this Concern by Delaying Selection (1)Higher proportion of homozygotes in later generations (2) if one observes a superior line in later generations, subsequent performance is more predictable.
Purifying lines for Cultivar Release • The first generation of yield testing may be F4:6 lines which will be somewhat variable • If they make the cut for further testing, then purification begins • The line that is eventually released as a cultivar may be F8 derived
Segregation at Multiple Loci with Self-Pollination • All F2 populations will be segregating at more than one locus. • This reduces the proportion of completely homozygous individuals compared to the case of single locus segregation.
Segregation at Multiple Loci with Self-Pollination • If the probability of homozygosity at the A or B locus is 0.5. The probability of homozygosity at both loci is 0.5 x 0.5 = 0.25.
The Potential Number of Genotypes is Huge • Assume parents in a cross have different alleles at n loci : 2n inbred genotypes can be derived from the cross. • If parents differ at 20 loci, then 220 or 1,048,576 genotypes are possible
Number of Genotypes in the F2 is even Bigger • Consider though, that 320 different genotypes are possible in the F2 generation--i.e., 3,486,784,401 • This fact makes inbreds seem attractive
Larger Populations or More Populations? • One of the most vexing plant breeding questions • Our F2 populations typically contain 1800 -2000 individuals; not 3,486,784,401! • This year at Lex we have > 500 F2 populations and a subset at Princeton
Larger Populations or More Populations? • I don’t believe in growing enormous populations in hopes of finding the perfect plant • Instead, we try to sample as many populations as possible in hopes of finding a few that meet our many selection criteria
Larger Populations or More Populations? • Current issue: are the pop sizes we are using for marker assisted selection big enough??
What are Transgressive Segregates? • Progeny that exceed the high parent • For example, assume a trait is governed by 20 loci • Inbred Parent 1 contains the superior allele at loci 1 to 11, • Inbred Parent 2 contains the superior allele at loci 12 to 20
What are Transgressive Segregates? • Plant breeding progress to date has been built on incremental gains in recovering progeny with additional superior alleles in the homozygous state
How to Predict Success • The Binomial Probability Formula: • P(x = k) = (nk)pk(1 - p)n-k • Where n = number of loci controlling the trait • k = number of loci homozygous for the superior allele • p= probability of fixing the superior allele in the homozygous state in the selfing generation Fi (i.e., 0.25 in F2; 0.375 in F3; 0.438 in F4)
How to Predict Success • The Binomial Probability Formula: • P(x = k) = (nk)pk(1 - p)n-k the binomial coefficient which estimates the number of ways in which k successes can be chosen from among n trials
How to Predict Success • Consider the likelihood of recovering homozygotes for the superior allele at 12 of 20 loci • F2: p = • F10: p =
Linkage • If favorable alleles are linked in coupling (eg AB), it works in the breeder’s favor • Repulsion linkages of favorable alleles (Ab) require recombination to break up • Fehr (p 56) gives example of nematode resistance and seed color (r=0.0035)
Recombination – More is Better, Isn’t It? • Linkage is a conservative influence which maintains parental arrangements The Debate: • Favorable linkage blocks should be maintained vs • More genetic variation should be unleashed through intermating