Download
1 / 38
380 likes | 498 Views
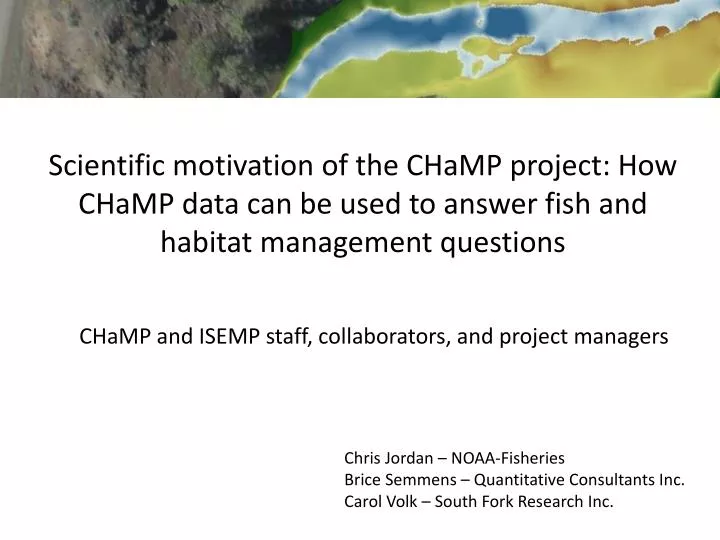
Scientific motivation of the CHaMP project: How CHaMP data can be used to answer fish and habitat management questions. CHaMP and ISEMP staff, collaborators, and project managers . Chris Jordan – NOAA-Fisheries Brice Semmens – Quantitative Consultants Inc.

E N D
Scientific motivation of the CHaMPproject: How CHaMP data can be used to answer fish and habitat management questions CHaMP and ISEMP staff, collaborators, and project managers Chris Jordan – NOAA-Fisheries Brice Semmens – Quantitative Consultants Inc. Carol Volk – South Fork Research Inc.
Scientific motivation of the CHaMPproject: How CHaMP data can be used to answer fish and habitat management questions Off-site mitigation strategy of the FCRPS Biological Opinion – stream habitat restoration can result in beneficial changes in salmon and steelhead populations.
How to show connection between habitat quantity and quality and freshwater survival? • Formal, experimental manipulation of stream habitat at fish response variable scale (population or major, closed section of population). • Mechanistic / process model to project population benefit based on per project change in habitat quality/quantity, habitat status, and fish response to habitat condition. • Correlation of habitat quality/quantity status and fish status across gradient of actions and confounding covariates.
How to show connection between habitat quantity and quality and freshwater survival? • Formal, experimental manipulation of stream habitat at fish response variable scale (population or major, closed section of population) • Mechanistic / process model to project population benefit based on per project change in habitat quality/quantity, habitat status, and fish response to habitat condition. • Correlation of habitat quality/quantity status and fish status across gradient of actions and confounding covariates. • All need Habitat Quality and Quantity data • Indicators of habitat quality • Indicators of habitat quantity • Indicators of change
How to show connection between habitat quantity and quality and freshwater survival? • Formal, experimental manipulation of stream habitat at fish response variable scale (population or major, closed section of population) • Mechanistic / process model to project population benefit based on per project change in habitat quality/quantity, habitat status, and, fish response to habitat condition. • Correlation of habitat quality/quantity status and fish status across gradient of actions and confounding covariates. • All need Habitat Quality and Quantity data • Indicators of habitat quality • Indicators of habitat quantity • Indicators of change
ISEMP Experimental Watersheds • Geographic • Upper Columbia • Wenatchee/Entiat • Mid Columbia • John Day • Snake • Salmon • Topical • Status/Trends • Population / Habitat • Effectiveness Monitoring • IMWs and extensive
Treatment Control 10 km Bear Creek Gable Creek Bridge Creek IMW Murderers Creek
Entiat IMW Experimental Design Restoration applied 1 = YAT or year after treatment
How to show connection between habitat quantity and quality and freshwater survival? • Formal, experimental manipulation of stream habitat at fish response variable scale (population or major, closed section of population) • Mechanistic / process model to project population benefit based on per project change in habitat quality/quantity, habitat status, and, fish response to habitat condition. • Correlation of habitat quality/quantity status and fish status across gradient of actions and confounding covariates. • All need Habitat Quality and Quantity data • Indicators of habitat quality • Indicators of habitat quantity • Indicators of change
Pool Pool Riffle Kenny Creek Riffle Glide Available Habitat: 86.2 km LWD per km: 24.7 m3 Fine Sediment: 26.6 % D50: 22.3 mm n = 2 Pool Canyon Creek Riffle Available Habitat: 64.0 km LWD per km: 70.7 m3 Fine Sediment: 34.2 % D50: 29.3 mm n = 3 Glide Bohannon Creek Pool Big Timber Available Habitat: 23.4 km LWD per km: 83.7 m3 Fine Sediment: 18.3 % D50: 53.5 mm Riffle Available Habitat: 103.0 km LWD per km: 45.9 m3 Fine Sediment: 20.8 % D50: 44.9 mm Glide n = 12 n = 11
How to show connection between habitat quantity and quality and freshwater survival? • Formal, experimental manipulation of stream habitat at fish response variable scale (population or major, closed section of population) • Mechanistic / process model to project population benefit based on per project change in habitat quality/quantity, habitat status, and, fish response to habitat condition. • Correlation of habitat quality/quantity status and fish status across gradient of actions and confounding covariates. • All need Habitat Quality and Quantity data • Indicators of habitat quality • Indicators of habitat quantity • Indicators of change
Monitoring must detect spatial and temporal patterns in habitat quality and quantity within and across watersheds Survey design Within watershed patterns Between watershed patterns ChaMP Habitat Quality and Quantity Indicators • Residual Pool Volume • Subsurface Fines • Total Drift Biomass • Bank Angle • LWD Volume • Fish Cover • Channel Unit Volume • Channel Unit Complexity • Riffle Particle Size • Riparian Structure • Solar Input • Average Alkalinity • Average Conductivity • Average pH • Growth Potential • Percent Below Summer T° Threshold • Percent Above Winter T° Threshold • Velocity Heterogeneity • Embeddedness of Fastwater Cobble • Pool Frequency • Channel Complexity • Channel Score
Monitoring must detect spatial and temporal patterns in habitat quality and quantity within and across watersheds Survey design Within watershed patterns Between watershed patterns ChaMP Habitat Quality and Quantity Indicators • Residual Pool Volume • Subsurface Fines • Total Drift Biomass • Bank Angle • LWD Volume • Fish Cover • Channel Unit Volume • Channel Unit Complexity • Riffle Particle Size • Riparian Structure • Solar Input • Average Alkalinity • Average Conductivity • Average pH • Growth Potential • Percent Below Summer T° Threshold • Percent Above Winter T° Threshold • Velocity Heterogeneity • Embeddedness of Fastwater Cobble • Pool Frequency • Channel Complexity • Channel Score
Analysis of habitat monitoring data • Used 30 habitat metrics from ISEMP monitoring program in Wenachee Sub-basin • 25 annual panel sites, visited 2004 - 2009 • Included stream morphology, riparian veg., woody debris, fish cover, pool features, sediment features, bank stability • Transformed and normalized • Status -- Use PERMANOVA to partition variance in multivariate habitat data • Trends -- Fit GLMMs to evaluate evidence of trends in habitat indicators through time across hierarchies of site organization
What If We Only Use CHaMP Indicators (Subset Wenachee ISEMP data)? • Embeddedness of fast water cobble • Pool Frequency • Residual pool volume • LWD volume • Fish cover • Channel unit volume • Riffle particle size • Densiometer
wenachee repeats 4 Strahler 4 2 2 1 AvgOfResidualPoolDepthr 3 TotalWoodVol_n_SiteLengthr SA_pools 5 PoolsPerKmr 0 FC_Total AvgOfDensiometerReadingr 2 C AvgOfStationEmbeddednessr P PercentCoarseGravelr -2 -4 -6 -6 -4 -2 0 2 4 PC1 Ordination by Strahler
2009: Within Site Variability (CHaMP Metrics Only) • In 2009, all sites were surveyed multiple times (mostly 3 times) to get at observation error Error Explained
What About Trends? • Consider only the CHaMP indicators • Interested in exploring linear trends • Account for random effects of watershed, ownership, Strahler order, and nested effects of sites within these factors • Use maximum likelihood and General Linear Mixed Models (GLMMs) • Evaluate model parsimony via AIC
Fish cover • Best AIC: FC_Total~ Year + (1|ownership)+ (1|site) Federal Private
Large Woody Debris • Best AIC: LWD ~ (1 | Strahler) + (1 | site) + (1 | ownership) 4 5 1 2 3
Relation to CHaMP? • We expect reductions in observation error (residual error) associated with stream morphology when using total station to map stream features • Demonstrates that coordinated monitoring yields a constellation of habitat data that, in concert, are powerful enough to detect differences among sites and changes though time at multiple levels of spatial organization
Monitoring must detect spatial and temporal patterns in habitat quality and quantity within and across watersheds Survey design Within watershed patterns Between watershed patterns ChaMP Habitat Quality and Quantity Indicators • Residual Pool Volume • Subsurface Fines • Total Drift Biomass • Bank Angle • LWD Volume • Fish Cover • Channel Unit Volume • Channel Unit Complexity • Riffle Particle Size • Riparian Structure • Solar Input • Average Alkalinity • Average Conductivity • Average pH • Growth Potential • Percent Below Summer T° Threshold • Percent Above Winter T° Threshold • Velocity Heterogeneity • Embeddedness of Fastwater Cobble • Pool Frequency • Channel Complexity • Channel Score
CHaMP watersheds relative to ICRB steelhead and sp/su Chinook population
Take Home Message • To evaluate the status and trends in salmon tributary habitat across the Columbia River basin, a basin-scale, consistent monitoring approach is required. • To evaluate the effectiveness of habitat restoration strategies in terms of fish population processes, a basin-scale, consistent monitoring approach is required.