Download
1 / 1
20 likes | 209 Views
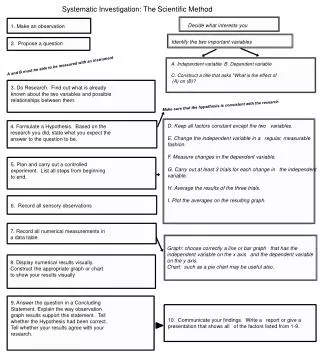
Systematic Investigation: The Scientific Method. Decide what interests you. 1. Make an observation. Identify the two important variables. 2. Propose a question. A and B must be able to be measured with an instrument. A. Independent variable B. Dependent variable

E N D
Systematic Investigation: The Scientific Method Decide what interests you 1. Make an observation Identify the two important variables 2. Propose a question A and B must be able to be measured with an instrument A. Independent variable B. Dependent variable C. Construct a title that asks "What is the effect of (A) on (B)? 3. Do Research. Find out what is already known about the two variables and possible relationships between them. Make sure that the hypothesis is consistent with the research D. Keep all factors constant except the two variables. E. Change the independent variable in a regular, measurable fashion. F. Measure changes in the dependent variable. G. Carry out at least 3 trials for each change in the independent variable. H. Average the results of the three trials. I. Plot the averages on the resulting graph. 4. Formulate a Hypothesis. Based on the research you did, state what you expect the answer to the question to be. 5. Plan and carry out a controlled experiment. List all steps from beginning to end. 6. Record all sensory observations 7. Record all numerical measurements in a data table Graph: choose correctly a line or bar graph that has the independent variable on the x axis and the dependent variable on the y axis. Chart: such as a pie chart may be useful also. 8. Display numerical results visually. Construct the appropriate graph or chart to show your results visually 9. Answer the question in a Concluding Statement. Explain the way observation graph results support this statement. Tell whether the Hypothesis had been correct. Tell whether your results agree with your research. 10. Communicate your findings. Write a report or give a presentation that shows all of the factors listed from 1-9.