Download
1 / 31
310 likes | 431 Views
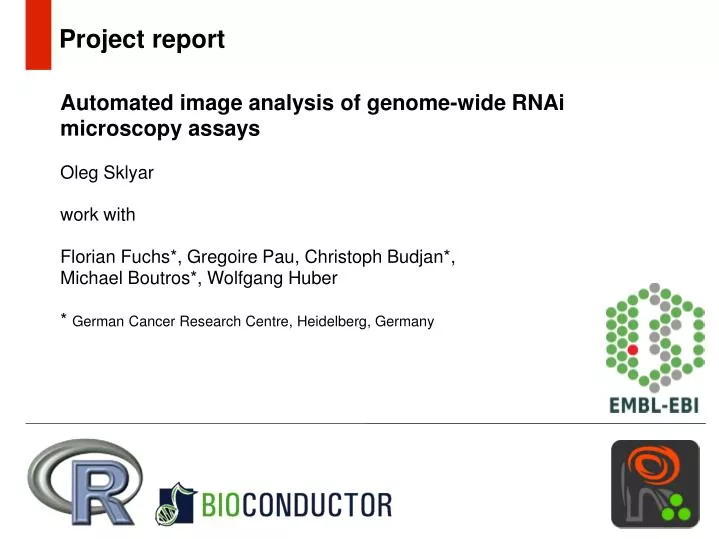
Project report. Automated image analysis of genome-wide RNAi microscopy assays Oleg Sklyar work with Florian Fuchs*, Gregoire Pau, Christoph Budjan*, Michael Boutros*, Wolfgang Huber * German Cancer Research Centre, Heidelberg, Germany. RNA interference (RNAi) gene silencing.

E N D
Project report Automated image analysis of genome-wide RNAi microscopy assays Oleg Sklyar work with Florian Fuchs*, Gregoire Pau, Christoph Budjan*, Michael Boutros*, Wolfgang Huber * German Cancer Research Centre, Heidelberg, Germany
RNA interference (RNAi) gene silencing An unknown gene showing phenotypic similarities to a set of known genes taking part in one and the same process is likely to share their function or be part of the same process. Challenge: how to compare phenotypes given as images in an automated manner?
Studying effects of gene silencing HeLa cells end-point assay - after 48h stain 3 channels: Actin (TRITC) Tubulin (Alexa 488) DNA (Hoechst) BD Pathway, 4 sites per well, two scans; 172,000 images à 1 MegaPixel, 12 bit 22K genes x 2 replicates x 4 locations x 3 channels = 528K images 22K genes x 500 cells per gene (in all 8 images) = 11M cells
Phenotypes Actin (TRITC) Tubulin (Alexa 488) DNA (Hoechst)
Data analysis Image analysis – extraction of numeric features (image descriptors) from images and objects in images
What is R? Why using R in this project? • R is a programming language and scripting environment for statistical computing and graphics. Aka FOSS S of Bell Labs or S+ of Insightful • very efficient on vectors, matrices, lists and data tables • extensive library of statistical routines • very effective in rapid prototyping, data analysis and hypothesis testing • extensible via packages, over 800 on CRAN, 200 on Bioconductor • very large developer base for statistical software • object oriented (if required) • flexible interface to C/C++ and Fortran for fast calculations • available virtually on all architectures • frequent releases (half-year)
The Bioconductor project is a cross-validated repository of R packages designed for bioinformatics and computational biology. • biology – a computational science: computational support and computational solutions for data analysis • complex but similar data structures: unification • availability of software to all biologists and labs • reproducible research requires open access to computational code • 29 core developers that develop and maintain the base packages; over 100 package developers
EBImage – R package for image analysis • S4-based object-oriented R code • high-level R API for C/C++ code (.Call interface) • cross-platform: UNIX/Linux, Win32, MacOS • GTK+ for cross-platform GUI • agile development framework: iterative, unit-based, complete units, frequent releases • 4500 lines of C/C++ code • 2000 lines of R code • 3200 lines of documentation • parts of code and testing by Mike Smith, Wolfgang Huber and Gregoire Pau • bug fixes, testing and ideas from R and Bioconductor communities
Algorithms included Object feature extraction hull and edge features variants of image moments Zernike moments Haralick texture features Object manipulation object matching painting objects on images stacking and tiling objects Tools colour manipulations drawing primitives, annotation interactive display Extensive help for all routines Examples Use case vignette Image processing • image enhancement • noise reduction, blur, smoothing • image transformations Image analysis • segmentation, edge detection • morphological transforms • watershed segmentation • Voronoi-based segmentation R algorithms applicable to arrays • histograms • data subsetting, manipulation • Fast Fourier transforms • quantile, kurtosis, stat. tests, ...
Finding nuclear envelopes (mask): segmentation with local adaptive threshold
Voronoi diagrams on image manifolds • partition metric space with n seeds into n convex polygons such that • each polygon contains exactly one seed • every point in a polygon is closer to its seed than to any other • Seed sets: nuclei • Space: Cytoplasmic mask • Metric: Gradient limit =10-5 Euclidian limit=105 [Carpenter, Jones et al., CellProfiler]
Data normalization Batch effects and the quality of controls Within-plate spatial trends
Clustering genes by phenotype GO: Lipid metabolic process Oxidoreductases acting on the CH-OH group of donors with NAD+ or NADP+ as acceptor HSD11B2: Corticosteroid 11-beta-dehydrogenase isozyme 2 HSD3B7: 3 beta-hydroxysteroid dehydrogenase type 7 (MIPS, Classification of Enzymes)
Distance • Assuming • Each gene i is described by a set of p descriptors • Distance d between gene i and j is parametric • Example • xik is the k-phenotype cell count observed on gene i • Weighted L2 distance: • Sigmoid-transformed coefficients + weighted L1 distance: • How to choose the parameters k,k and k ?
Optimising distance over SPRING • STRING is a pairwise gene interactions database. • Idea: distance of genes picked on STRING should be lower in average than between random genes • Find the distance parameters k, k and k thatmaximize the separation between the distributions
Acknowledgements and references Wolfgang and the group for guidance, help and support R and Bioconductor developer communities EBI, DKFZ and HFSP (via a research grant to W. H. and M.B.) for financial support Rwww.r-project.org Bioconductorwww.bioconductor.org EBImagewww.ebi.ac.uk/~osklyar/EBImage (or Bioconductor) imageHTSwww.ebi.ac.uk/~osklyar/imageHTS