Download
1 / 39
450 likes | 1.35k Views
EOG for REM Sleep Detection. Robert Slavicek & Andrew Wassef. Description of Problem. Over 12 million people suffer from sleep apnea Americans average 6.22 hours of sleep a night, well below the recommended 7 to 8 hours

E N D
EOG for REM Sleep Detection Robert Slavicek & Andrew Wassef
Description of Problem • Over 12 million people suffer from sleep apnea • Americans average 6.22 hours of sleep a night, well below the recommended 7 to 8 hours • Currently sleep studies of patients must be done outside of the home and are expensive
Objectives • Wanted to create a cheap, portable sleep observation system • Taking input signals from temperature and eye movement • Be able to identify when patient is in REM sleep
Original Design Test Subject (Electrodes) Signal Filtering and Amplification Signal Filtering and Amplification Test Subject (Thermistor) Summer Circuit Data Acquisition & Storage C Program & Display
Original Design • Obtain clear, useable signal • Have system be functional for multiple patients • Need to insure patient safety • Need to sample at a frequency high enough so that no relevant eye data is lost
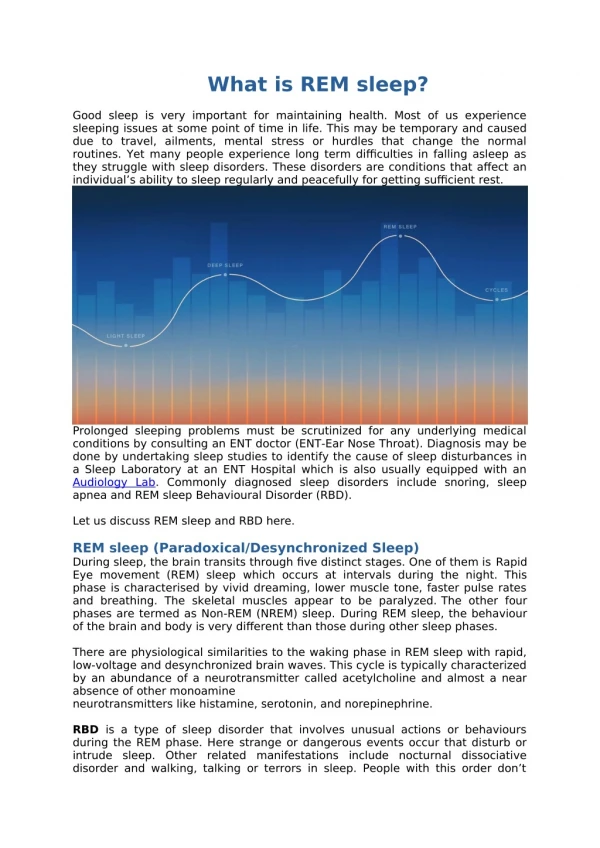
Biosignal: Corneal Retinal Potential • Natural mV dipole between the cornea and the retina of the eye • Front of eye is positively charged, while back is negatively charged • Measured by placing electrodes directly lateral to each eye on the canthi and a reference electrode to the forehead
Eye Motion If you look right: - right electrode reads positive voltage - left electrode reads negative voltage - circuit takes difference of electrodes - net voltage is positive (pos-neg) If you look left: - exact opposite of looking right - net voltage is negative (neg-pos)
Buffer Circuit: isolates the output from the signal source Differential Amplifier: Rejects signals common to both electrodes 4th Order Low Pass Filter: attenuates signals from frequencies greater than 35Hz
Variable Amplifier: allows operator to control the gain for each subject Summer Circuit: allows operator to block DC offset Inverting Amplifier: increases signal to better differentiate eye movement
Wein Bridge Oscillator Electronic oscillator used to generate a sine wave so that the temperature sensor is at a different frequency spectrum
Temperature Sensor Implementing the temperature signal with the eye signal
Data Acquisition • Used a 16-bit sound card to acquire data • Data was collected through a program Audacity • Audacity collected the data into a .wav file at 8000KHz sampling • Files of a night’s sleep were about 230 MBs of storage.
Data Acquisition • From Audacity, we import the .wav file into Matlab • Matlab’s “wavread()” command sorts the .wav data into a M by 2 Matrix
Data Acquisition • When we sort this data into a matrix, we can perform the FFT (Fast Fourier Transform) • We isolate the frequency range of the eye signal from the temperature signal
Data Acquisition • Using Matlab’s “sptool” command, we could isolate each signal for analysis • Sptool contains FIR bandpass and LS low pass filters that can filter out either signal
Data Acquisition • Used LS low pass filter, order of 80 cutoff at 170 Hz
Data Acquisition • After filtering the original signal we can send the time domain signal back to matlab in a data array • The data array can be exported as a .txt file to be further analyzed. Filtered
C Program Analysis of Data Output file from Matlab
C Program Analysis of Data remsun1> eog Enter input file name: eogin.txt Enter sampling frequency (Hz): 20 Would you like to average the data (y/n)?: n The output file 'out.txt' was written successfully! Would you like to view it (y/n)?: y Left at 0.4500 s due to -0.2017 V Right at 1.9500 s due to 0.2179 V Left at 3.7500 s due to -0.2174 V Right at 5.5000 s due to 0.2285 V Left at 7.2500 s due to -0.2547 V Right at 9.0000 s due to 0.2144 V Left at 10.7000 s due to -0.2121 V Right at 12.5000 s due to 0.2120 V Left at 14.3000 s due to -0.2259 V Right at 16.0000 s due to 0.2297 V Left at 18.0500 s due to -0.2486 V Right at 18.4500 s due to 0.2181 V Left at 18.8500 s due to -0.2195 V Right at 19.3500 s due to 0.2295 V Left at 19.9000 s due to -0.2308 V
Final Output File Left at 0.4500 s due to -0.2017 V Right at 1.9500 s due to 0.2179 V Left at 3.7500 s due to -0.2174 V Right at 5.5000 s due to 0.2285 V Left at 7.2500 s due to -0.2547 V Right at 9.0000 s due to 0.2144 V Left at 10.7000 s due to -0.2121 V Right at 12.5000 s due to 0.2120 V Left at 14.3000 s due to -0.2259 V Right at 16.0000 s due to 0.2297 V Left at 18.0500 s due to -0.2486 V Right at 18.4500 s due to 0.2181 V Left at 18.8500 s due to -0.2195 V Right at 19.3500 s due to 0.2295 V Left at 19.9000 s due to -0.2308 V
Functional Tests Left at 0.0500 s due to -0.2066 V Right at 0.5500 s due to 0.4051 V Left at 1.2000 s due to -0.2246 V Right at 1.9500 s due to 0.4172 V
Functional Tests Left at 0.0500 s due to -0.4279 V Right at 0.1500 s due to 0.1525 V Left at 0.4000 s due to -0.3228 V Right at 0.6500 s due to 0.1831 V Left at 0.8500 s due to -0.3472 V Right at 1.0500 s due to 0.1239 V Left at 1.3500 s due to -0.3410 V Right at 1.5500 s due to 0.1944 V Left at 1.8500 s due to -0.3426 V Right at 2.1000 s due to 0.2452 V Left at 2.3000 s due to -0.3210 V Right at 2.5500 s due to 0.1284 V Left at 2.8000 s due to -0.3957 V Left at 3.2500 s due to -0.3876 V Right at 3.5500 s due to 0.2024 V Left at 3.7500 s due to -0.3952 V Right at 4.0500 s due to 0.2044 V Left at 4.2500 s due to -0.4400 V Left at 4.7000 s due to -0.3433 V Right at 4.9500 s due to 0.1645 V Left at 5.1500 s due to -0.3439 V
Functional Testing remsun1> eog Enter input file name: eogin.txt Enter sampling frequency (Hz): 20 Would you like to average the data (y/n)?: n The output file 'out.txt' was written successfully! Would you like to view it (y/n)?: y Left at 1.5500 s due to -0.2017 V Right at 1.9500 s due to 0.2179 V Left at 2.4500 s due to -0.2174 V Right at 2.8000 s due to 0.2285 V Left at 3.2500 s due to -0.2547 V Right at 3.8000 s due to 0.2144 V Left at 4.4500 s due to -0.2121 V Right at 5.1000 s due to 0.2120 V Right at 6.0500 s due to 0.2297 V Left at 7.9500 s due to -0.2486 V Right at 8.4500 s due to 0.2181 V Left at 8.8500 s due to -0.2195 V Right at 9.3500 s due to 0.2295 V Left at 9.9000 s due to -0.2308 V Right at 11.3500 s due to 0.2295 V Right at 13.0000 s due to 0.2235 V Right at 18.4500 s due to 0.2102 V
Successes • Effectively captured lateral eye motion and temperature changes in human subjects in a portable device • Measured and stored changes in these signals over an entire night of sleep • Ensured patient safety • Display in a user friendly fashion when a subject displays mannerisms of REM sleep
Challenges • Actually recovering a signal from the lateral eye motion • Offset of electrodes pushed signal out of viewable range and signals were lost due to saturation • Electrodes slipped off during sleep / uneasy sleep • Digitally sample the two signals in one sound card • Temperature not responsive enough to accurately gauge when REM sleep occurs
Recommendations • Could add more functionality by adding EEG, EMG, HR, or BP monitors to help better determine the exact time of REM sleep
Recommendations • A feedback loop in the circuit to normalize the retinal-corneal dipole signal from all users rather than having to manually adjust the potentiometer in the circuit and the threshold values in the program • A more accurate and sensitive temperature sensor