Download
1 / 9
90 likes | 339 Views
No more linear functions. What happens graphically when an equation's high power is 2? Lets check it out on graphing calculator. This graph is called a parabola. The Parabola (The Picture). . . Vertex (h,k). . Axis of Symmetry. So we understand what a parabola looks like in general. Are there any trends like with absolute value and greatest integer functions?Lets check that out too! .

E N D
1. 2-6 Graphing Quadratic Functions A change of the high power = 1
to high power = 2
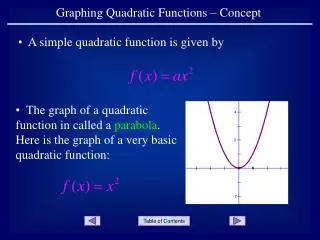
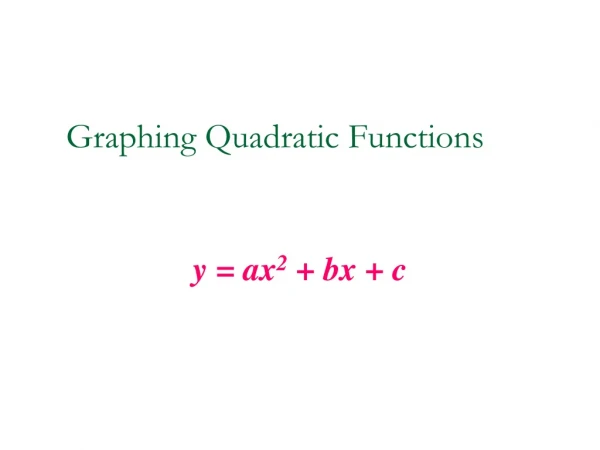
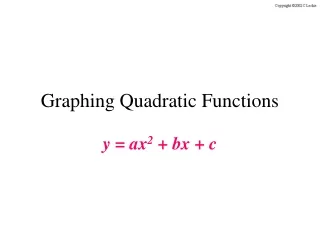
2. No more linear functions What happens graphically when an equation�s high power is 2?
Lets check it out on graphing calculator.
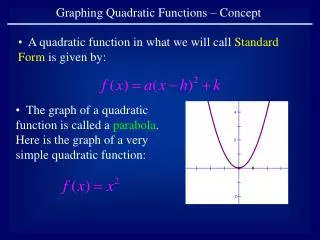
This graph is called a parabola
3. The Parabola (The Picture)
4. So we understand what a parabola looks like in general.
Are there any trends like with absolute value and greatest integer functions?
Lets check that out too!
5. So, we see some trends We probably won�t use trends; much like absolute values, one easy way to graph parabolic functions is to plot the vertex and then plot 2 points on either side of the x coordinate of the vertex.
6. The Parabola (The Equation) From what we saw, these are the trends:
Add/Subtract inside the squared quantity?
? Move vertex left/right
Add/Subtract outside the squared quantity?
? Move vertex up/down
Multiply/Divide inside or outside?
? Changes Steepness
7. The Parabola (The Equation)
a changes shape (steepness of curve)
(h, k) is the vertex of the parabola.
If a < 0, what will happen to the graph?
8. So what will we do with this information? Determine the vertex (h, k).
Find 2 x values on either side of h and plug them in to find 4 points to graph.
If asked to, determine domain (hint what CAN�T you put in?)
If asked to, determine range (hint � decide up/down orientation then think about where you will move from the vertex).
9. Lets try some examples