Download
1 / 13
130 likes | 156 Views
Graphing Quadratic Functions. y = ax 2 + bx + c CCSS: F.IF. 4. CCSS: F.IF.4.

E N D
Graphing Quadratic Functions y = ax2 + bx + c CCSS: F.IF. 4
CCSS: F.IF.4 • For a function that models a relationship between two quantities, INTERPRET key features of graphs and tables in terms of the quantities, and SKETCH graphs showing key features given a verbal description of the relationship. Key features include: intercepts; intervals where the function is increasing, decreasing, positive, or negative; relative maximums and minimums; symmetries;end behavior; and periodicity.*
Essential Question: • What are the three forms of a quadratic function, and how do I use the information from each to graph the function?
Mathematical Practices: • 1. Make sense of problems and persevere in solving them. • 2. Reason abstractly and quantitatively. • 3. Construct viable arguments and critique the reasoning of others. • 4. Model with mathematics. • 5. Use appropriate tools strategically. • 6. Attend to precision. • 7. Look for and make use of structure. • 8. Look for and express regularity in repeated reasoning.
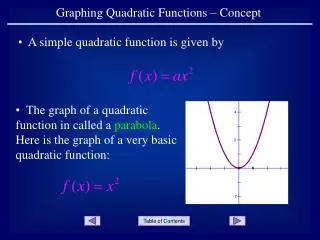
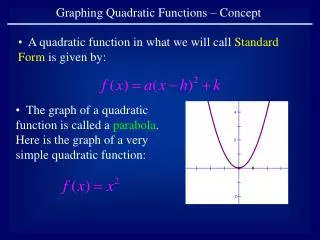
y Vertex x Vertex Quadratic Functions The graph of a quadratic function is a parabola. A parabola can open up or down. If the parabola opens up, the lowest point is called the vertex. If the parabola opens down, the vertex is the highest point. NOTE: if the parabola opened left or right it would not be a function!
y a > 0 x a < 0 Standard Form The standard form of a quadratic function is y = ax2 + bx + c The parabola will open up when the a value is positive. The parabola will open down when the a value is negative.
Line of Symmetry y x Line of Symmetry Parabolas have a symmetric property to them. If we drew a line down the middle of the parabola, we could fold the parabola in half. We call this line the line of symmetry. Or, if we graphed one side of the parabola, we could “fold” (or REFLECT) it over, the line of symmetry to graph the other side. The line of symmetry ALWAYS passes through the vertex.
Finding the Line of Symmetry When a quadratic function is in standard form For example… Find the line of symmetry of y = 3x2 – 18x + 7 y = ax2 + bx + c, The equation of the line of symmetry is Using the formula… This is best read as … the opposite of b divided by the quantity of 2 times a. Thus, the line of symmetry is x = 3.
Finding the Vertex y = –2x2 + 8x –3 We know the line of symmetry always goes through the vertex. STEP 1: Find the line of symmetry Thus, the line of symmetry gives us the x – coordinate of the vertex. STEP 2: Plug the x – value into the original equation to find the y value. To find the y – coordinate of the vertex, we need to plug the x – value into the original equation. y = –2(2)2 + 8(2) –3 y = –2(4)+ 8(2) –3 y = –8+ 16 –3 y = 5 Therefore, the vertex is (2 , 5)
USE the equation A Quadratic Function in Standard Form The standard form of a quadratic function is given by y = ax2 + bx + c There are 3 steps to graphing a parabola in standard form. MAKE A TABLE using x – values close to the line of symmetry. Plug in the line of symmetry (x – value) to obtain the y – value of the vertex. STEP 1: Find the line of symmetry STEP 2: Find the vertex STEP 3: Find two other points and reflect them across the line of symmetry. Then connect the five points with a smooth curve.
y x A Quadratic Function in Standard Form Let's Graph ONE! Try … y = 2x2 – 4x – 1 STEP 1: Find the line of symmetry Thus the line of symmetry is x = 1
y x A Quadratic Function in Standard Form Let's Graph ONE! Try … y = 2x2 – 4x – 1 STEP 2: Find the vertex Since the x – value of the vertex is given by the line of symmetry, we need to plug in x = 1 to find the y – value of the vertex. Thus the vertex is (1 ,–3).
y x y x 2 3 A Quadratic Function in Standard Form Let's Graph ONE! Try … y = 2x2 – 4x – 1 STEP 3: Find two other points and reflect them across the line of symmetry. Then connect the five points with a smooth curve. –1 5