Download
1 / 39
420 likes | 690 Views
Ch. 7 Multifactorial & Polygenic Traits. Genes, Environment and Traits. Few , if any, genes act alone Environmental factors and other genes may modify expression Traits can be described as Mendelian = Caused by a single gene Polygenic = Caused by multiple genes

E N D
Genes, Environment and Traits • Few, if any, genes act alone • Environmental factors and other genes may modify expression • Traits can be described as • Mendelian = Caused by a single gene • Polygenic = Caused by multiple genes • Both can be multifactorial or complex due to an interaction between genes and the environment
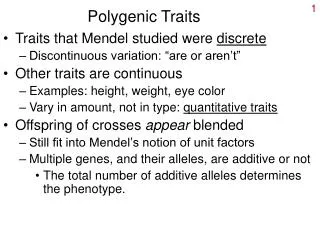
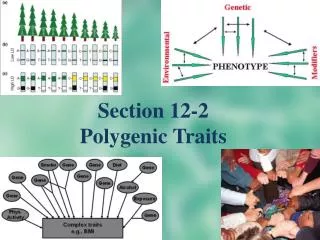
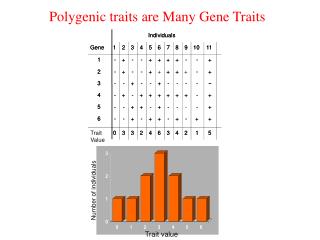
Genes, Environment and Traits Single-gene traits are discrete or qualitative Often produce an “all-or-none” effect Polygenic traits produce a continuously varying phenotype Often produce a “Shades of Gray” effect Also called quantitative traits DNA sequences involved are termed quantitative trait loci (QTLs)
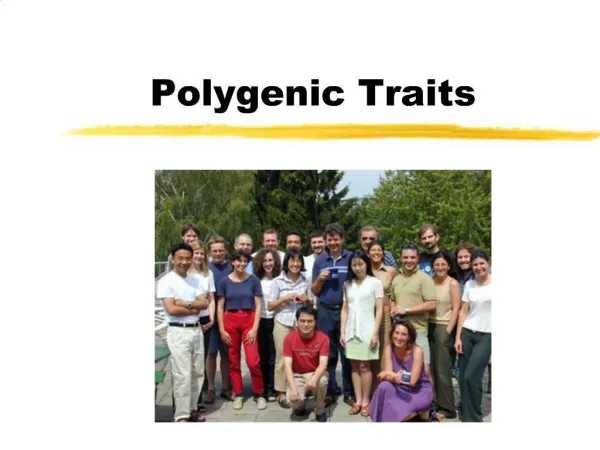
Polygenic Traits Are influenced by interaction of genes and by the environment Examples: - Height - Skin color - Body weight - Fingerprint patterns - Behavioral traits
Polygenic Traits Individual genes follow Mendel’s laws, but their expression is hard to predict Effect of genes is additive or synergistic - However, input of genes is not necessarily identical The frequency of distribution of phenotypes forms a bell-shaped curve!
Fingerprint Patterns Dermatoglyphics is the study of fingerprints The number of ridges is largely determined by genes and prenatal contact Identical twins, don’t have the exact same whorls, loops, and arches because of accidents in PRENATAL DEVELOPMENT
Height • The difference in height between the two sets of students is attributed to improved diet and better overall health
Height Genome-wide association studies have identified dozens of genes that affect height Also, certain SNPs (Single nucleotide polymorphisms) patterns are seen in individuals with periods of rapid height increase
Skin Color Melanin protects against DNA damage from UV radiation, and exposure to the sun increases melanin synthesis We all have same number of melanocytes per unit area of skin However, we differ in melanosomenumber, size and density distribution
Skin Color The definition of race based largely on skin color is a social construct more than a biological concept Skin color is NOT a reliable indicator of ancestry Overall, 93% of varying inherited traits are no more common in people of one skin color than any other
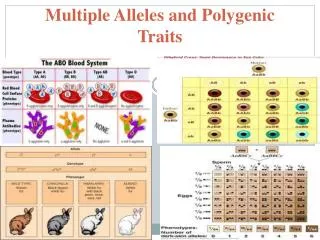
Eye Color • EYE COLOR is actually thought to be controlled by several genes,andit’s the number of total alleles an individual has that will determine whether the eyes are: • Light blue (0), blue/green (1), light brown (2), medium brown (3), or dark brown (4) • Eye COLOR is polygenic but not multifactorial (environment has no effect on eye color)
Green Hazel Brown Two genes specify greenish-blue pigments call lipochromes, and two or more other genes encode brownish melanins. These genes act in a hierarchy, with the brown genes masking the green/blues, and EVERYTHING would mask the “pure blue” Grey Blue
Multifactorial Trait • Traits that are affected by genes and the environment in which you are brought up in. • Examples: • Heart Disease • Intelligence • Personality • Mood • Behavior • Body Weight
Body Weight Body weight is a multifactorial trait that reflects energy balance About 30% of all adults in the US are obese, and another 35% are overweight Scientific studies use a measurement called body mass index (BMI) = weight (kg)/height2 (m2)
Body Weight Studies on adopted individuals and twins indicate a heritability of 75% for obesity Lifestyle, including diet and exercise, are environmental components impacting weight Genes influence hunger and metabolism
Leptin and Associated Proteins Leptin is a protein hormone produced by fat cells Acts on the brain to decrease appetite Ghrelin is a peptide hormone produced in the stomach Responds to hunger by increasing appetite These and other hormones are important for general weight regulation
Epigenetics • The genome dynamically responds to the environment. • Stress, diet, behavior, toxins and other factors activate chemical switches that regulate gene expression. • Epigenetic changes • Changes to the chemical groups that associate with DNA that are transmitted to daughter cells after cell division • Changes the expression of genes.
Epigenetics & Twins Video 4 min http://learn.genetics.utah.edu/content/epigenetics/control/
Investigating Multifactorial Traits Empiric risk measures the likelihood that a trait will recur based on incidence Predicts the risk that a single-gene trait will recur within a family. It is a population statistic based on observation. Incidence is the rate at which a certain event occurs Prevalence is the proportion or number of individuals who have a particular trait at a specific time
Heritability • Designated (H) –Estimates the proportion of the phenotypic variation in a population due to genetic differences • Differs from empirical risk b/c ER could result from nongenetic influences • H=1 for a trait that is completely responsible from one gene action. • No Environmental Influence! • Will change as environment changes • Height = 0.8 • Mathematical Aptitude = 0.3
Heritability (H) Researchers use several statistical methods to estimate heritability One way is to compare the proportion of people sharing a trait to the proportion predicted to share the trait The expected proportion is derived by knowing the blood relationships of the individuals
Heritability • Coefficient of relatedness • The proportion of genes shared between two people related in a certain way
Adopted Individuals Similarities between adopted people and adopted parents reflect mostly environmental influences Similarities between adoptees and their biological parents reflect mostly genetic influences Therefore, information on both sets of parents can reveal how heredity and the environment both contribute to a trait
Twins Twin studies have largely replaced adoption methods Separate nature vs. nurture (ie: genetic vs. environmnetal) Concordance measures the frequency of expression of a trait in both members of monozygotic (MZ) or dizygotic (DZ) twins Twins who differ in a trait are said to be discordant for it For a trait largely determined by genes, concordance is higher for MZ than DZ twins
Separating Genetic and Environmental Influences • Dizygotic twins = Shared environment and 50% of genes • Monozygotic twins = Identical genotype and shared environment • Twins raised apart = Shared genotype but not environment • Adopted individuals = Shared environment but not genes
Genome-Wide Association Studies Older techniques search for known gene variants, typically in only a few people Sequencing of the human genome and the HapMap project (which identifies SNPs) have led to a new tool Genome-wide association studies seek correlations between SNP patterns and phenotypes in large groups of individuals
SNPs SNPs (single nucleotide polymorphisms) are sites in a genome where the DNA base varies in at least 1% of the population In these studies, SNPs span the genome, rather than define a single gene A SNP can be anywhere among our roughly 3.2 billion base pairs
Genome-wide association studies seek SNPs that are shared with much greater frequency among individuals with the same trait than among others Figure 7.10
A Step-wise Approach to Gene Discovery Figure 7.11
Study Designs In a cohort study, researchers follow a large group of individuals over time and measure many aspects of their health In a case-control study, pairs of individuals are matched so that they share as many characteristics as possible - SNP differences are then associated with the presence or absence of the disorder
Study Designs The “affected sibling pair” strategy scans genomes of siblings for SNPs shared by those with the condition, but not by those who don’t have it Homozygosity mapping is performed on families that are consaguineous - The children in this case are more likely to inherit two copies of the mutation
Limitations of Genome-Wide Association Studies 1) They include so many data points and so are prone to error 2) They reveal associations between two types of information, not causes 3) Bias can be introduced in the way the patient population is selected 4) Their accuracy is affected by complicating factors, such as phenocopy and epistasis 5) They may miss extremely rare SNPs