Download

1 / 12
120 likes | 267 Views
Analysis of GO annotation at cluster level by Agnieszka S. Juncker. The DNA Array Analysis Pipeline. Question Experimental Design. Array design Probe design. Sample Preparation Hybridization. Buy Chip/Array. Image analysis. Normalization. Expression Index Calculation. Comparable

E N D
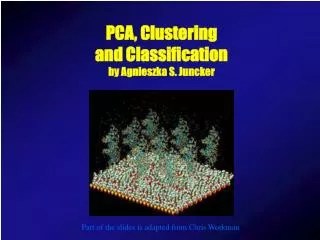
Analysis of GO annotation at cluster levelby Agnieszka S. Juncker
The DNA Array Analysis Pipeline Question Experimental Design Array design Probe design Sample Preparation Hybridization Buy Chip/Array Image analysis Normalization Expression Index Calculation Comparable Gene Expression Data Statistical Analysis Fit to Model (time series) GO annotations Advanced Data Analysis Clustering PCA Classification Promoter Analysis Meta analysis Survival analysis Regulatory Network
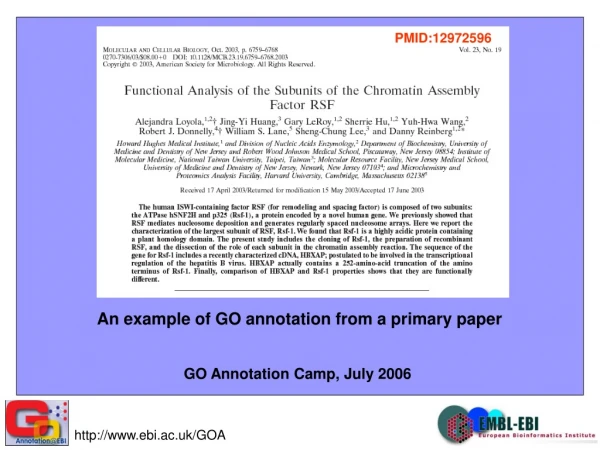
Gene Ontology Gene Ontology (GO) is a collection of controlled vocabularies describing the biology of a gene product in any organism There are 3 independent sets of vocabularies, or ontologies: • Molecular Function (MF) • e.g. ”DNA binding” and ”catalytic activity” • Cellular Component (CC) • e.g. ”organelle membrane” and ”cytoskeleton” • Biological Process (BP) • e.g. ”DNA replication” and ”response to stimulus”
KEGG pathways • KEGG PATHWAYS: • collection of manually drawn pathway maps representing our knowledge on the molecular interaction and reaction networks, for a large selection of organisms • 1. Metabolism • Carbohydrate, Energy, Lipid, Nucleotide, Amino acid, Other amino acid, Glycan, PK/NRP, Cofactor/vitamin, Secondary metabolite, Xenobiotics • 2. Genetic Information Processing • 3. Environmental Information Processing • 4. Cellular Processes • 5. Human Diseases • 6. Drug Development
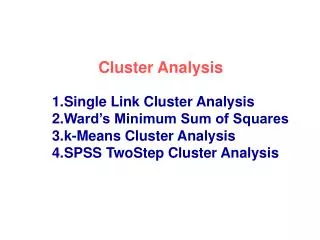
Cluster analysis and GO Analysis example: • Partitioning clustering of genes into e.g. 15 clusters based on expression profiles • Assignment of GO terms to genes in clusters • Looking for GO terms overrepresented in clusters
Hypergeometric test • The hypergeometric distribution arises from sampling from a fixed population. 10 balls • We want to calculate the probability for drawing 7 or more white balls out of 10 balls given the distribution of balls in the urn 20 white balls out of 100 balls
Sampling Y Y Y Y Y Y Y Time Gene1 Gene2 Time Yeast cell cycle Time series experiment: Gene expression profiles:
R stuff Indexing of a matrix (used when you wish to select a subset of your data, e.g. specific rows or columns): • Example 1 rowindex <- 1:10 colindex <- 1:5 datamatrix[rowindex, colindex] # first 10 rows, first 5 columns datamatrix[1:10, 1:5] # gives the same as above “Missing” rowindex (or columnindex) means that all rows (or columns) are selected • Example 2 datamatrix[1:5,] # 5 first rows, all columns datamatrix[,5:10] # all rows, columns 5 to 10 datamatrix[,] # is the same as datamatrix