Download
1 / 37
370 likes | 473 Views
A comprehensive overview of the NOx SIP Rule's impact on reducing ozone levels, including emissions reductions, EPA estimates, and statistical analysis of ozone concentrations in metropolitan areas.

E N D
Local Ozone Forecasting and theNOx SIP Call Rule William F. Ryan Department of Meteorology The Pennsylvania State University National Air Quality Conference, Orlando, 2007
Background • In 1998, EPA finalized the "Finding of Significant Contribution and Rulemaking for Certain States in the Ozone Transport Assessment Group Region for Purposes of Reducing Regional Transport of Ozone." (Commonly called the “NOx SIP Rule”.) • The NOx SIP Rule was designed to mitigate the transport of NOx, one of the precursors of ozone. • The obligations under this Rule can be, and have been, met through a cap and trade program (EPA NOx Budget Trading Program, or NBP). • The SIP Rule is part of a suite of control programs including the Acid Rain program and OTC NOx Budget Program.
Phase In of the NOx SIP Rule • Compliance with the SIP Rule set for May, 2003 in the OTC (Northeast Corridor) and May 31, 2004 in most other states. Litigation was extensive. • By 2005, the rule affected ~ 2,500 units. • 85% electric generating units • 15% large industrial units • Continuous emissions monitoring system (CEMS) used to verify emissions.
Extent of NOx Reductions • EPA estimates that, by 2005, NOx emissions from sources regulated by the NOx SIP Rule area have decreased by 57% over 2000 emissions. • EPA also estimates that O3 concentrations have been reduced, on average, by 14%, after adjustments for meteorology, for the period 1997-2004.
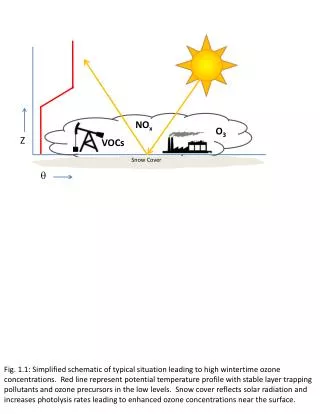
Effect of Regional NOx Controls • Scientific consensus was that O3 concentrations in the eastern US, outside of large urban areas, is NOx-limited. • Therefore, reductions in NOx emissions regionwide will reduce the “background” or “regional scale” O3 concentrations. • Local emissions and photochemistry will still lead to “spikes” in O3, often Code Orange or higher, but these spikes will build on a lower base and be of reduced magnitude.
Hypotheses • If regional NOx reductions work as planned, we should see: • Slight decrease in urban mean peak O3 (why slight?) • Decrease in extreme O3 days. • Decrease in the areal extent of high O3 on bad air days (fewer monitors > threshold). • Decrease in O3 measured at regional scale monitors.
Caveats • Results can only be considered provisional. Time series, or time since controls enacted, is too short to support final conclusions. • High O3 in the mid-Atlantic is a complicated combination of meteorological and chemical influences and we cannot conclusively “adjust” for seasonal and sub-seasonal meteorological variations. • e.g., Temperature, wind speed and relative humidity, common meteorological correction factors, only explain ~ 58% of variance in PHL peak O3.
Why Will Regional Rule Affect PHL O3? Source region for air parcels arriving in PHL during summer pollution events is typically from the west. Example from 2000 shown at right.
Observed O3 in Regional Transport Cases Aircraft observations in central VA during a 1995 O3 episode show high concentrations of O3 coupled with high SO2 and NOy – consistent with coal combustion source Surface observations at Shenandoah NP (above) during a westerly transport regional pollution episode in 1998 showed high O3 concentrations coupled with high SO2 – a signature of coal combustion.
NOx SIP Rule Emissions Reductions Occurred in Source Region of Interest
Slight Reduction in Urban Peak O3 Reduction on order of 10% - consistent with EPA regionwide findings 1994-2002: 70 ppbv 2003-2006: 63.2 ppbv Mean summer season metro-wide peak 8-hour O3 concentrations in PHL
Decrease in Extreme O3 Days: Philadelphia Metropolitan Area Frequency of Days ≥ 115 ppbv 1994-2002: 4.8 days/year 2003-2006: 0.8 days/year
Decrease in Areal Extent of High O3: Number of Monitors ≥ 100 ppbv Average = 61 monitors/yr Average = 15
Frequency of High O3 Cases per SeasonVaries with Temperature Regime Hot Warm Summer 1999 T925 - JJA Cool Summer 1996 T925 - JJA Temperature Anomaly Cold Number of Monitors ≥ 100 ppbv
But, Warm Season of 2006 Did Not Show Similar Response as Earlier Years Cool Season 2004 T925 - JJA Warm Season 2006 T925 - JJA
Overall: Post NOx SIP Rule Summer Seasons As Warm or Warmer than Previous Years T925 Anomaly 1997-2002 JJA Average number of monitors ≥ 100 ppbv 8-hour average: 1994-2002: 61.3 1997-2002: 71.0 2003-2006: 15.2 T925 Anomaly 2003-2006 JJA
Hot Weather Not Always = High O3:Fraction Decreases after 2002 Code Red days (May-September) divided by the number of days ≥ 90º F during same period. 1994-2002: 0.40 (40%) 2003-2006: 0.09 (9%) Hot summers less likely to be smoggy summers
Temperature-O3 Relationship in PHL: Distribution of O3 for Given Temperature Ranges (1997-2002) Arrows show mean O3 for temperature range for 2003-2006. Box is interquartile (25-75%) range 80-84 85-89 90-94 ≥ 95 Maximum Temperature (F)
After 2003, Almost All High O3 Cases are Limited to Code Orange Percentage of monitors exceeding the Code Orange threshold (85 ppbv) that also exceed 100 ppbv. 1994-2003: 27% 2004-2006: 5%
Shenandoah National Park O3 Mean Daily 8-Hour Maximum O3 May-September 1994-2002: 60 ppbv 2003-2006: 54 ppbv 15% reduction June-August 1994-2002: 61 ppbv 2003-2006: 55 ppbv 15% reduction
Large Reduction in Frequency and Spatial Extent of High O3 Periods at SNP Average Number of Days with 1-hour O3 ≥ 70 ppbv: 1994-2002: 38 2003-2006: 12 224% Reduction Average Number of Hours with O3≥ 70 ppbv: 1994-2002: 392 2003-2006: 106 268% Reduction
Effect on Forecasts (1) PHL regression model forecast bias for concentration bins of observed peak 8-hour O3 (Model R0302)
Effect on Statistical Forecasts (2) Same as in previous slide but for another PHL statistical model (Ln2001)
Effect on NOAA Numerical Forecast Model NOAA Forecast Model Assumes Large NOx Reductions
Verification During Summer, 2006: PHL Domain Maximum O3 • Bias + 3.1 ppbv • Mean absolute error 8.5 ppbv and median absolute error 6.0 ppbv. • Best statistical model for same days: Bias = +4.9 ppbv, Mean AE = 9.1 ppbv, Median AE = 7.7 ppbv. • Performance in PHL is good compared to statistical models and does not under-predict.
Performance in High O3 Cases • Model results not available for two cases. • Correctly forecast Code Orange cases on 14 of 17 days (Consensus forecast 13/17). • Cost of only 3 False Alarms (convection an issue in one case). • Under-predicted 2 Code Red cases but did not wildly over-predict during heat wave of July 31-August 3.
Monitor Specific Forecasts • For set of 9 monitors: • Range of Bias: - 2 to + 6.8 ppbv • Underpredicted at PNE (urban) and overpredicted at Collier’s Mills (exurban) • Range of Mean AE: 8.6-11.7 ppbv • Best at Fair Hill (MD) and worst at PNE. • Range of Median AE: 6-8 ppbv • Best at Rider, NJ along I-95 Corridor.
Conclusions • Preliminary observations suggest that NOx SIP Rule has reduced urban scale as well as regional scale O3 concentrations. • Effect is seen most dramatically in frequency and extent of high O3 cases. • Impact on statistical forecast guidance is limited – on the order of a few ppbv. • Numerical models that adjust for NOx reductions perform adequately.
Acknowledgements • Thanks to Amy Huff (Penn State) for forecasting assistance and to Chad Bahrmann (Penn State) for analysis of NOAA model data. • Thanks to the Delaware Valley Regional Planning Commission (DVRPC) and member states (DE, PA, NJ) for their support of air quality forecasting.