Download
1 / 27
270 likes | 413 Views
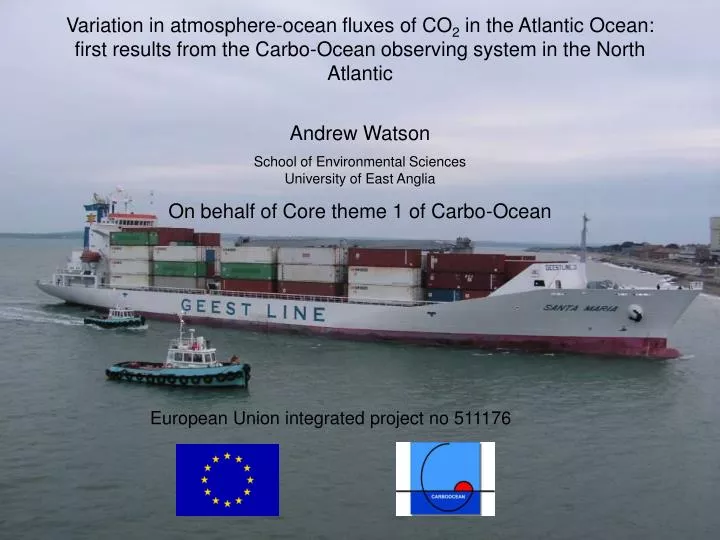
Variation in atmosphere-ocean fluxes of CO 2 in the Atlantic Ocean: first results from the Carbo-Ocean observing system in the North Atlantic Andrew Watson School of Environmental Sciences University of East Anglia On behalf of Core theme 1 of Carbo-Ocean.

E N D
Variation in atmosphere-ocean fluxes of CO2 in the Atlantic Ocean: first results from the Carbo-Ocean observing system in the North Atlantic Andrew Watson School of Environmental SciencesUniversity of East Anglia On behalf of Core theme 1 of Carbo-Ocean European Union integrated project no 511176
Thanks to… • Truls Johannesen, Are Olsen, Abdiraman Omar • Arne Körtzinger, Tobias Steinhoff • Ute Schuster, Maciek Telzewski • Jon Olafsson • Antoine Corbière, Nicolas Metzl, Nathalie Lefèvre • Aida Rios, Fiz Perez, Martina Alvarez • Nick Bates • Heike Lüger, Rik Wanninkhof • …and many others
Annual flux of CO2 across the sea surface a climatology for 2000 -9 -5 0 5 9 [mol m -2 year -1] from Takahashi et al (2006) in preparation
[mol CO2 m-2] Total ANTHROPOGENIC CO2 in the oceans by 1994 from Sabine et al (2004) Science305: 367 - 371
The Carbo-ocean North Atlantic observing system • The first co-ordinated, operational multi-ship voluntary observing network for sea surface pCO2 and air-sea flux. • Currently 5 commercial ships of opportunity and one research vessel. • Co-ordinated with US and Canadian observing efforts. • Aims: an accurate assessment of air-sea flux at seasonal-or-better time resolution, ~<10º latitude spatial resolution.
First results… • In 2005: • the North Atlantic was a sink for atmospheric CO2 everywhere from 14º to 65ºN, in all seasons except summer (JJA) when it was a weak source south of 55ºN • Seasonal cycle in phase at all latitudes. • The overall sink for the region 14-65ºN was calculated at 0.24 Pg C for 2005 • Compare Takahashi climatology (~1995) for the region, calculated with same assumptions: 0.40 Pg C • Is there a decrease?
Measurements between the UK and the Caribbean in the mid-1990s and the early 2000s from Schuster and Watson (2006) JGR,in review
Sea surface pCO2 [μatm] between the UK and the Caribbean in the mid-1990s and the early 2000s 50ON 45ON 40ON 35ON 30ON 25ON 1994 1995 50ON 45ON 40ON 35ON 30ON 25ON 2002 2003 2004 2005 from Schuster and Watson (2006) JGR,in review
400 Northeast region 380 360 Sea surface pCO2 [μatm] 340 320 300 400 Average 1994/95 Southwest region 280 Feb Apr Jun Aug Oct Dec Average 2002/05 380 360 Sea surface pCO2 [μatm] 340 320 300 280 Feb Apr Jun Aug Oct Dec The changes in sea surface pCO2 [μatm] versus month from Schuster and Watson (2006) JGR,in review
Flux = (pCO2atm – pCO2SW) * K * s Average 1994/95 Average 2002/05 1994/95 with 2002/05 temperature 2002/05 with 1994/95 wind speed The changes in air-sea flux of CO2 [mol m -2 yr -1] versus latitude 3 2 Air-to-sea flux CO2 [mol m -2 year -1] 1 0 25 30 35 40 45 50 55 Latitude [oN] from Schuster and Watson (2006) JGR,in review
Sea surface pCO2 in the western subpolar gyre 400 Atmospheric 380 360 pCO2 [µatm] 340 320 300 Sea surface 280 1994 1996 1998 2000 2002 2004 adapted from Corbière et al (2006) Tellus B,in press
Sea surface pCO2 in the western subtropical gyre near Bermuda 420 400 380 360 pCO2 [μatm] 340 320 Atmospheric 300 Sea surface 280 2000 1995 1985 1990 adapted from Bates (2006) JGRin review
Air-to-sea CO2 flux in the western subtropical gyre near Bermuda 3 2 Air-to-sea flux CO2 [mol m -2 year -1] 1 0 2000 1995 1985 1990 adapted from Bates (2006) JGRin review
3 4 1 5 6 2 Change in air-to-sea CO2 flux versus change in sea surface temperature adapted from Schuster and Watson (2006) JGR,in review 5 6 0 2 Change in air-to-sea CO2 flux [mol m-2 yr-1] -1 4 1,2: Schuster and Watson (2006) 3: Corbière et al. (2006) 4,5: Lüger et al. (2006) 6: Bates (2006) 1 3 -2 1 0 0.2 0.4 0.6 0.8 Change in SST [oC] Assigning approximate areas to these regions we estimate a decrease in the sink, from mid 90s, to 2002-2005, of 0.24 +/- 0.05 Pg C yr-1 ~60% of the “climatological” flux. The North Atlantic sink is very variable on decadal time scales!
Changes in the North Atlantic Oscillation (Dec to Mar) High index Lower index Lower index Data from Climate Research Unit, University of East Anglia
Changes in North Atlantic surface currents, e.g. the subpolar gyre 1992 to 2002 determined by altimetry data from Häkkinen and Rhines (2004) Science304: 555 - 559
Summary • The North Atlantic sink for atmospheric CO2 is very variable on decadal time scales: in particular, it probably declined ~50% from the mid 90s to the early 2000s. Most current ocean carbon models cannot reproduce this variability. • Under Carbo-Ocean, an operational observing system has been established which, for the first time in any ocean basin, enables calculation of air-sea flux with good time and space resolution. • Ongoing work: improve the estimation of fluxes • determine the underlying causes of changes • Use fluxes, in concert with the terrestrial and atmospheric carbon community, to constrain the overall carbon budget
Countries, institutions, and companies involved in the research
Reservoirs in Pg C (= 1015 g C) Fluxes in Pg C year- -1 The global carbon cycle Total atmosphere: 750 100 50 50 92 Plants: 500 90 50 Surface ocean: 670 Total ocean: 38,400 Total land: 2,000 Soil & detritus: 1,500 98 100 Deep ocean: 36,700 Total lithosphere: > 75,000,000 adapted from IPCC (2001) Anthropogenic 6.3
The changes between the UK and the Caribbean annual air-to-sea flux monthly sea surface pCO2 from Schuster and Watson (2006) JGR,in review
80 60 40 Column inventory [mol m -2] 20 0 80oS 40oS 0o 40oN Latitude Anthropogenic CO2 in the different ocean basins from Sabine et al (2004) Science305: 367 – 371, supplement
80 60 40 20 0 80oS 40oS 0o 40oN Latitude Anthropogenic CO2 in the different ocean basins 0.6 0.4 Latitudinal inventory [mol m -2] Total laitudinal inventory [Pg C] 0.2 0.0 80oS 40oS 0o 40oN Latitude from Sabine et al (2004) Science305: 367 – 371, supplement