Download
1 / 3
30 likes | 127 Views
Newfoundland and Labrador. 76. 102. Nova Scotia. 111. 98. Quebec. Manitoba. Ontario. Saskatchewan. 101. 87. 200. 93. Prince Edward Island. New Brunswick. PROVINCE. 1000’s of $. Alberta. 160. British Columbia. 231. MTH-5102 Quiz Chapters 1 and 2 Feb 12, 2008

E N D
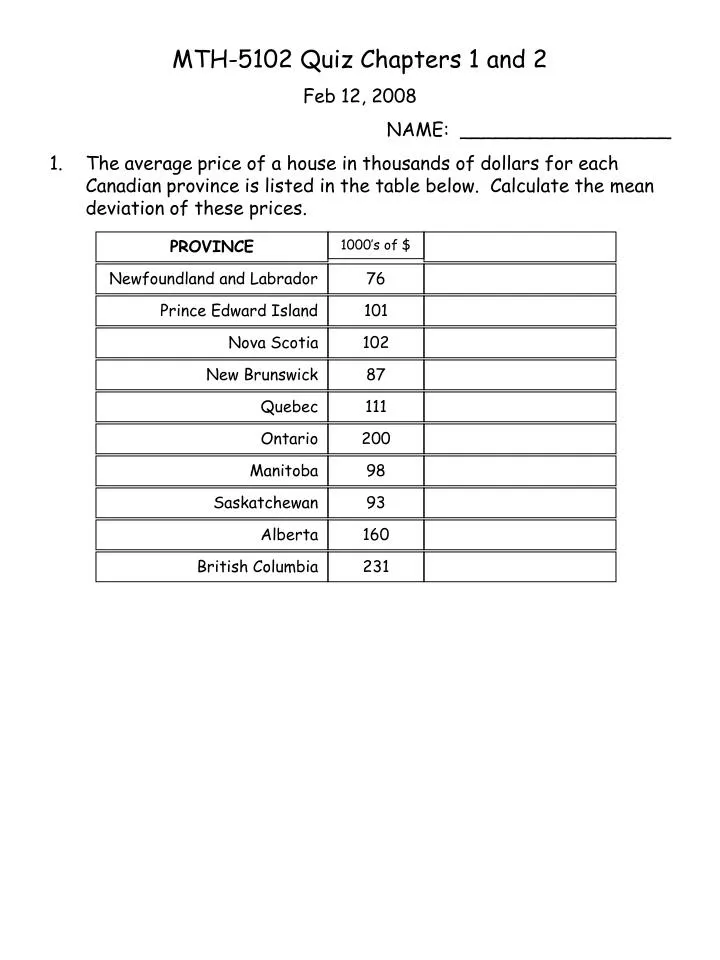
Newfoundland and Labrador 76 102 Nova Scotia 111 98 Quebec Manitoba Ontario Saskatchewan 101 87 200 93 Prince Edward Island New Brunswick PROVINCE 1000’s of $ Alberta 160 British Columbia 231 MTH-5102 Quiz Chapters 1 and 2 Feb 12, 2008 NAME: __________________ 1. The average price of a house in thousands of dollars for each Canadian province is listed in the table below. Calculate the mean deviation of these prices.
MONTH Expenses May March January July 48 120 150 80 98 72 78 80 86 79 86 240 160 95 71 60 90 200 August 75 52 42 74 April 60 June 63 February September 110 October 80 November 70 December 280 76 68 80 84 2. The credit card expenses in dollars for an individual are listed on a monthly basis. • What is the arithmetic mean for the expenses? • __________ • What is the standard deviation? • __________ • What is the standard score for the month of December? 3. a) The marks for a class are listed below. Determine the mean and standard deviation of this group. • There was an additional mark of 22 that was removed from that list. What impact did removing this mark have on the mean? And the standard deviation?
72 Standard Deviation 12 Standard Score 1.5 65 Mean Data Value 9.5 6 75 -0.24 72 85 1.28 80 4. Fill the empty columns of the table below that lists a given data value with its group mean, standard deviation and the standard score for the data value.