Download
1 / 24
240 likes | 324 Views
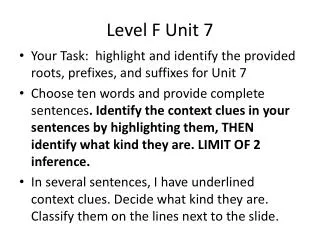
Emma Wilson Avondale College. Experiments at Level 7. Estimate the age of this person. Some results I prepared earlier .

E N D
Emma Wilson Avondale College Experiments at Level 7
On the next slide, you will be shown some dots. You will be given 3 seconds to look at the slide. You will then need to write down how many dots you think were on the slide.
Write down the number of dots you think were shown on the slide
On the next slide, you will be shown some dots. You will be given 3 seconds to look at the slide. You will then need to write down how many dots you think were on the slide.
Write down the number of dots you think were shown on the slide
Some results I prepared earlier SHIFT SHAPE UNUSUAL SPREAD CENTRE CONTEXTUAL
Linking letters READY….. SET….
Some results I prepared earlier What do the lines/links show you? Is there a pattern to the links? Are the lines mostly going up or down? Why are some steeper than others? “expanding” or “compressing”?
Some results I prepared earlier Are there big gaps between differences? How similar are the differences? How wide is the box compared to the tails? How do the differences compare to 0? Where are the middle 50% of results? Does the whole box sit above or below 0? Are the clusters/groupings of differences? Where is the centre/peak? What is the shape of the distribution of differences?
Some results I prepared earlier Do we have a random sample? No Are we making a sample to population inference? No Do we have a population? No
Some results I prepared earlier What do the lines/links show you? Is there a pattern to the links? Are the lines mostly going up or down? Why are some steeper than others? “expanding” or “compressing”?
Some results I prepared earlier Are there big gaps between differences? How similar are the differences? How wide is the box compared to the tails? How do the differences compare to 0? Where are the middle 50% of results? Does the whole box sit above or below 0? Are the clusters/groupings of differences? Where is the centre/peak? What is the shape of the distribution of differences?
Myth busters video - ice swearing Did they hold their hand in longer because of swearing OR because they already had done the activity before so knew what to expect?? They knew they were part of an experiment – how much did this push them?
How do you assess this? • Students work in groups to develop problem and plan from background information and provided situation (8 per class) • Students work in groups to conduct experiment and collect data • Students work individually to write up the whole report (introduction, method, results, conclusion/discussion) in more depth
Advice/Ideas to take away • Focus on one type of experiment • Experience and discuss lots of experiments • Teach literacy - don’t avoid it • Stay WELL away from sampling-to-population ideas (variation or inferences) • Focus on exploratory data analysis – what is the data telling you about the experiment • Is the shift/spread from what you did or is there another explanation?