Download
1 / 42
420 likes | 773 Views
Computer Graphics. Chapter 7 3D Object Modeling. 3D Object Representation. y = f(x,z) . A surface can be analytically generated using its function involving the coordinates. An object can be represented in terms of its vertices, edges and polygons. (Wire Frame, Polygonal Mesh etc.)

E N D
Computer Graphics Chapter 7 3D Object Modeling
3D Object Representation y = f(x,z) • A surface can be analytically generated using its function involving the coordinates. • An object can be represented in terms of its vertices, edges and polygons. (Wire Frame, Polygonal Mesh etc.) • Curves and surfaces can also be designed using splines by specifying a set of few control points. x y z . . .
Solid Modeling - Polyhedron • A polyhedron is a connected mesh of simple planar polygons that encloses a finite amount of space. • A polyhedron is a special case of a polygon mesh that satisfies the following properties: • Every edge is shared by exactly two faces. • At least three edges meet at each vertex. • Faces do not interpenetrate. Faces at most touch along a common edge. • Euler’s formula : If F, E, V represent the number of faces, vertices and edges of a polyhedron, then V + FE = 2.
3D Object Representation • The data for polygonal meshes can be represented in two ways. • Method 1: • Vertex List • Normal List • Face List (Polygon List) • Method 2: • Vertex List • Edge List • Face List (Polygon List)
Vertices and Faces - E.g. Cube 2 5 4 3 1 1 0 5 6 7 0 2 3 4 Vertex Index Face Index
Regular Polyhedra (Platonic Solids) • If all the faces of a polyhedron are identical, and each is a regular polygon, then the object is called a platonic solid. • Only five such objects exist.
Wire-Frame Models • If the object is defined only by a set of nodes (vertices), and a set of lines connecting the nodes, then the resulting object representation is called a wire-frame model. • Very suitable for engineering applications. • Simplest 3D Model - easy to construct. • Easy to clip and manipulate. • Not suitable for building realistic models.
Polygonal Mesh • Three-dimensional surfaces and solids can be approximated by a set of polygonal and line elements. Such surfaces are called polygonal meshes. • The set of polygons or faces, together form the “skin” of the object. • This method can be used to represent a broad class of solids/surfaces in graphics. • A polygonal mesh can be rendered using hidden surface removal algorithms.
Solid Modeling • Polygonal meshes can be used in solid modeling. • An object is considered solid if the polygons fit together to enclose a space. • In solid models, it is necessary to incorporate directional information on each face by using the normal vector to the plane of the face, and it is used in the shading process.
Surface Modeling Y y = f(x, z) X Z Many surfaces can be represented by an explicit function of two independent variables, such as y = f(x, z).
Sweep Representations • Sweep representations are useful for both surface modeling and solid modeling. • A large class of shapes (both surfaces and solid models) can be formed by sweeping or extruding a 2D shape through space. • Sweep representations are useful for constructing 3-D objects that posses translational or rotational symmetries.
Extruded Shapes - Examples A polyhedron obtained by sweeping (extruding) a polygon along a straight line is called a prism.
Surface of Revolution • A surface of revolution is obtained by revolving a curve (known as the base curve or profile curve) about an axis. • In other words, a surface of revolution is generated by a rotational sweep of a 2D curve. • The symmetry of the surface of revolution makes it a very useful object in presentation graphics.
Surface of Revolution Y y = f(x) y = f(r) y y x X r (x, z) Z
Surface of Revolution The three-dimensional surface obtained by revolving the curve y = f(x) about the y-axis is obtained by replacing x with sqrt(x*x + z*z). The surface of revolution is thus given by
Quad trees Quad trees are generated by successively dividing a 2-D region(usually a square) into quadrants. Each node in the quadtree has 4 data elements, one for each of the quadrants in the region. If all the pixels within a quadrant have the same color (a homogeneous quadrant), the corresponding data element in the node stores that color. For a heterogeneous region of space, the successive divisions into quadrants continues until all quadrants are homogeneous.
Octrees • An octree encoding scheme divide regions of 3-D space(usually a cube) in to octants and stores 8 data elements in each node of the tree. • Individual elements of a 3-D space are called volume elements or voxels. • When all voxels in an octant are of the same type, this type value is stored in the corresponding data element of the node. Any heterogeneous octant is subdivided into octants and the corresponding data element in the node points to the next node in the octree.
Bezier Curves The Bezier curve only approximates the control points and doesn’t actually pass through all of them.
Bezier Curves Inputs: n control points (xi, yi), i = 0, 1,2, …n-1 m = n1
Bezier Curves Inputs: n control points (xi, yi), i = 0, 1,2, …m
p1 p1 p3 p2 p0 p0 p2 Properties of Bezier Curve • Bezier curve is a polynomial of degree one less than the number of control points Quadratic Curve Cubic Curve
Properties of Bezier Curve (cont.) • Bezier curve always passes through the first and last points; i.e. and ,
p1 p1 p2 p2 p0 p0 Properties of Bezier Curve (cont) • The slop at the beginning of the curve is along the line joining the first two control points, and the slope at the end of the curve is along the line joining the last two points.
Properties of Bezier Curve (cont) • Bezier blending functions are all positive and the sum is always 1. • This means that the curve is the weighted sum of the control points.
p2 p1 p0=p5 Design Technique using Bezier Curves: • A closed Bezier curve can be generated by specifying the first and last control points at the same location p3 p4
p1 = p2 p3 p0 p4 Design Technique (Cont) • A Bezier curve can be made to pass closer to a given coordinate position by assigning multiple control points to that position.
p1 p’3 p2= p’0 p0 p’1 p’2 • Bezier curve can be form by piecing of several Bezier section with lower degree.
Bezier Surfaces (Not Important!)
Bezier Patch A set of 16 control points The Bezier Patch
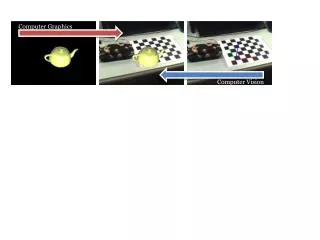
Bezier Patch Utah Teapot Defined Using Control Points
Bezier Patch Utah Teapot Generated Using Bezier Patches