Download
1 / 11
110 likes | 244 Views
Avoiding Transmission and Fossil Backup Maximizing Ratepayer Value. Craig Lewis Executive Director Clean Coalition 650-204-9768 craig@clean-coalition.org. 11 April 2012. Avoided Transmission in CA = $80 Billion over 20 yrs. Business as Usual Year-20 TAC (TAC 20 ) = 2.7. 2.7.

E N D
Avoiding Transmission and Fossil Backup Maximizing Ratepayer Value Craig Lewis Executive Director Clean Coalition 650-204-9768 craig@clean-coalition.org 11 April 2012
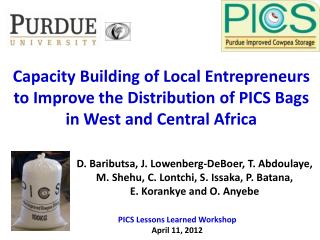
Avoided Transmission in CA = $80 Billion over 20 yrs Business as Usual Year-20 TAC (TAC20 ) = 2.7 2.7 Business As Usual TAC Growth Current TAC Rate (TAC0) = 1.2 TAC0 O&M Level Business as Usual TAC Growth TAC0 Depreciation + O&M Avoided TAC Opportunity from DG
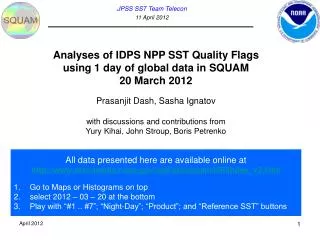
Avoided Fossil Backup = Funds for Superior Solutions Too Much Demand GW Too Much Supply Time of day Frequency Regulation • Stabilizes grid at 60 Hz. • Commonly provided by natural gas powered generators, but all fossil sources are slow ramping. • Energy Storage and Demand Response are nearly instantaneous while providing a multitude of additional benefits. 60 50 40 30 20 10 0 12a 6a 12p 6p 12a
Back-Up Slides Back-Up Slides
CLEAN Programs Deliver Cost-Effective Scale Solar Markets: Germany vs California (RPS + CSI + other) Cumulative MW Sources: CPUC, CEC, SEIA and German equivalents. Germany added nearly 15 times more solar than California in 2011, even though California’s solar resource is 70% better!!!
Wholesale DG is the Critical & Missing Segment Central Generation ~20 MW-and-larger Project Size Wholesale DG, <20 MW Retail DG <1 MW Behind the Meter Distribution Grid Transmission Grid
German Solar Capacity is Small WDG (Rooftops) 26% 23.25% 22.5% 19% 9.25% Source: Paul Gipe, March 2011 Germany’s solar deployments are almost entirely <2 MW rooftop projects interconnected to the distribution grid (not behind-the-meter)
Wholesale DG has Superior Value Total Ratepayer Cost of Solar Sources: CAISO, CEC, and Clean Coalition, July 2011; see full analysis at www.clean-coalition.org/studies The most cost-effective solar is ground-based WDG, not central station as commonly thought; due to immense transmission costs
Connecting-the-Dots to Reform • 75% of California IOU capital expenditures are made on the distribution grid (D-grid) and California ratepayers deserve maximized returns on their MASSIVE investments (2007 IEPR) • Investment needs to be future-proofed to allow significant penetrations of clean local energy • Confidentiality rules need to change to allow proper regulatory oversight of these massive ratepayer investments • Germany and Spain are excellent proxies for assuring that California’s existing D-grid can accommodate significant penetrations of clean local energy (May 2011 CEC/KEMA report) • MPR is determined at point-of-interconnect and Wholesale Distributed Generation (WDG) and a Locational Benefits (LBs) adder is needed to compensate for extra value of WDG • Average extra LBs value of DG is in the neighborhood of 25% (Transmission Access Charges of 1.5 cents/kWh plus 10% for transmission line/congestion losses) • The LBs adder should be handled just like the Time-of-Delivery (TOD) adder • Ratepayers currently get massive free value from WDG in the form of uncompensated LBs
Connecting-the-Dots to Reform (continued) • Currently, developers are responsible for 100% of D-grid upgrade costs without any opportunity for reimbursement, EVER • This is different than transmission upgrade costs that are ALWAYS borne by the ratepayer • Recommendation for the 50% of the D-grid where LBs value is above average, utilities pay for D-grid upgrades and recover through the rate-base. • Ratepayers currently get massive free value from WDG in the form of uncompensated D-grid upgrade costs • Wholesale Distributed Generation (WDG) interconnections need to be far more timely and transparent • WDG interconnection processes in IOU D-grids are expected to require an average of 2 years • WDG interconnection processes in the SMUD D-grid requires 6 months • Interconnection studies for 100 MW of WDG projects in its Feed-In Tariff program were completed in 2 months (performed by 2 guys) • 100 MW of WDG in SMUD territory is equivalent to 2,500 MW of WDG statewide • TWO GUYS for TWO MONTHS should be an achievable benchmark for all utilities