Download
1 / 28
280 likes | 402 Views
Markov chain modeling and ENSO influences on the rainfall seasons of Ethiopia. By Endalkachew Bekele from NMSA of Ethiopia endbek2002@yahoo.com Banjul, Gambia December 2002. INTRODUCTION.

E N D
Markov chain modeling and ENSO influences on the rainfall seasons of Ethiopia By Endalkachew Bekele from NMSA of Ethiopia endbek2002@yahoo.com Banjul, Gambia December 2002
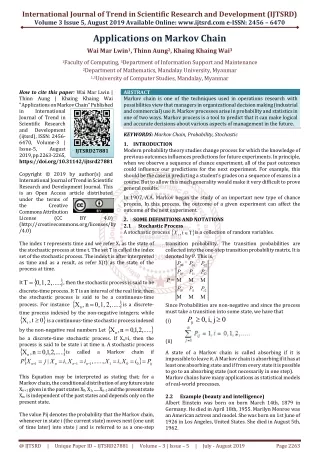
INTRODUCTION • The seasonal rainfall predictions issued by the NMSA of Ethiopia are mainly the results of ENSO analogue methodologies. • Hence, it is good to study the existing relationship between the ENSO episodic events and the Ethiopian rainfall. • The Markov Chains approach can be useful in this regard.
INTRODUCTION (continued) • If we provide a statistician with historical data of rainfall and ask him to tell us the probability of having rainfall on 9 December, he may go through simple to complex computations: • Simple:- If he computes the ratio of number of rainy days on December 9 to the total number of years of the historical data. • Complex:- If he considers the Markov Chain processes
INTRODUCTION (continued) • Markov Chain Processes w.r.t. daily rainfall: Previous days’ event Today’s event Order - wet zero wet wet first dry wet first wet wet wet second dry wet wet second wet dry wet second dry dry wet second
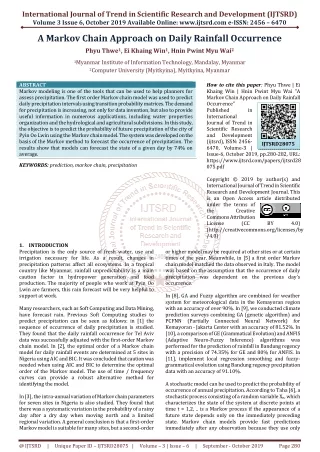
By applying such simple to complex statistical methods (Markov chain modeling) to the daily rainfall data obtained from three meteorological stations in Ethiopia, the following results were obtained:
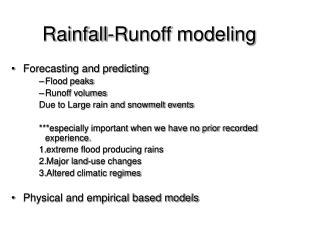
Why Modeling? • It is the best tool in describing the characteristics rainfall in Tropics (Stern et al) • It leads to simulation of long-years daily rainfall data • By using the simulated data, it would be simple to compute: • Start and end of the rains • Study the effects of ENSO events • Dry-spells etc…
What next? • The available rainfall data were categorized under: • Warm (El Nino)----1965,1966,1969,1972… • Cold (La Nina) -----1964,1971,1973,1974…and • Normal episodes-----1967,1968,1970, 1976…. (based on: http:/www.cpc.noaa.gov/products/analysis_monitoring/ensostuff/ensoyear.htm • Then hundred years of daily rainfall data were simulated for each episodic events(El Nino and La Nia).
How the simulation is done? • The frequency distribution of daily rainfall amount is assumed to have a form of Gamma distribution: • Where, all parameters in F(x) are obtained while fitting curves of the appropriate Markov Chain model (mean rain per rainy day and conditional probabilities).
How the simulation is done? • For example, for the simulation done on the Addis Ababa r/f data: • 0-order mean rain per rainy days • 2nd order Markov chain for chances of rain and • K (El Nino) = 0.942 and K (La Nina) = 0.963 were used
What next? • Hundred years of daily rainfall data were simulated for each episodic years • Monthly and seasonal rainfall amounts were computed from the simulated data • The following cumulative probability curves were produced from the the monthly and seasonal summaries:
Cumm. Prob. Of Belg rainfall during ENSO episodic years • The less the slope of the curves (if they become more horizontal) means the higher the inter-annual variability in seasonal rainfall amount. • The higher the gap between the two curves means the higher the effect of the episodic events.
Cumm. Prob. Of Belg (Feb. to May) rainfall during ENSO episodic years • In 80% of the years the seasonal rainfall is as high as 200mm during El Nino events, while it is less than 100mm (only about 90mm) during La Nina events. • Hence, an agricultural expert can make his decision, if he is provided with such useful information.
Cumm. Prob. Of Kiremt (June to September) rainfall during ENSO episodic years at Addis Ababa
Dry-spells • The same simulated data can be used to study various other events such as: • Start and end of the rains • Dry-spells etc… • The dry spell condition computed for each episodic years are summarized in the following way:
Prob. Of ten days dry-spell length during ENSO years at A.A. • La Nina increases the chances of having 10 days dry-spell • in the small rainy season, while El Nino decreases that risk.
Conclusion • Markov chain modeling is a good tool for studying the daily rainfall characteristics. • Its application doesn’t necessarily need long-years data. • It summarizes large data records into equations of few curves and few k values. • It can be used best in the study of the effects of ENSO on Ethiopian rainfall activity. • The results obtained from this approach can be best used for agricultural planning in Ethiopia.