Download
1 / 25
260 likes | 427 Views
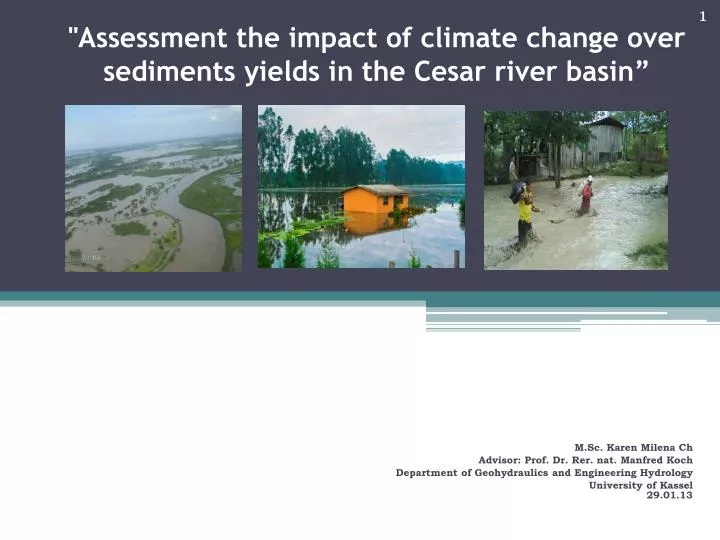
"Assessment the impact of climate change over sediments yields in the Cesar river basin”. M.Sc. Karen Milena Ch Advisor : Prof. Dr. Rer . nat . Manfred Koch Department of Geohydraulics and Engineering Hydrology University of Kassel 29.01.13. Location of study area.

E N D
"Assessment the impact of climate change over sediments yields in the Cesar river basin” M.Sc. Karen Milena Ch Advisor: Prof. Dr. Rer. nat. Manfred Koch Department of Geohydraulics and Engineering Hydrology University of Kassel29.01.13
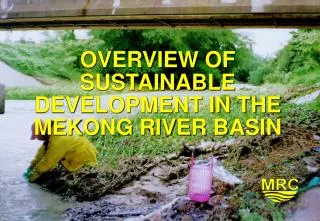
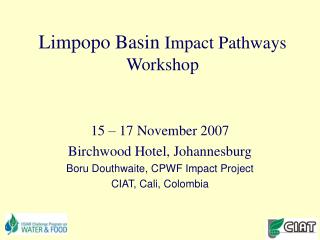
Location of study area Sierra nevada de Santa Marta Serrania de Perija Valley of River Cesar Cienaga de la Zapatosa
Stamentoftheproblem • For the district of Cesar, one of the most important water resources is the Cesar river. • One of the major environmental problems in the region has been the massive deforestation of most of the forests to make way for agricultural uses that may lead to ecological imbalances.
From the point of view of agriculture, inadequate use of natural resources, such as the use of mechanization without the prior classification of the agro-ecological zone. • In an area, as the Cesar basin, which is rich in topographical and soil physiological conditions, erosion and sedimentation could occur in several ways. Schumacher T.E, et al. (1999), states that net soil loss from tillage erosion occurs on slope lands as a result of gravity acting on movingsoil.
According to a study of climate modeling in Colombia conducted by Pabón J.D, (2006), in the Cesar region the trend of air temperature might increase 0.17 °C per decade, and the trend of precipitation 1.46% per decade for that region. • From the agricultural point of view, the United Nations system in its review of risks and opportunities associated with climate change states that the effects associated with this phenomenon could be the aridity, soil erosion, desertification and changes in the hydrological regime as well as increased risk of flooding in agricultural production affecting crops.
The main objective • The main objective of this research is to assess the impact of climatic change over sedimentation yield in the Cesar basin, which is located in the Cesar district in northern of Colombia using SWAT (Soil Water Assessment Tool) model. • Specificobjectives: Establish the historical behavior of climatic and hydrological variables in the basin of the CesarRiver. Evaluate sedimentation yield in the basin under climate change.
SWAT Model1 Soil Water Assessment Tool SWAT is a physically based, watershed-scale, continuous time, distributed-parameter hydrologic model that uses spatially distributed data on topography, land use, soil, and weather for hydrologic modeling and operates on a daily time step (Arnold et al., 1998; Arnold and Fohrer, 2005). Based on topography, this model subdivides a watershed into a number of subbasinsfor modeling purposes. In latinaAmérica SWAT has been used in countries as: México2; Brasil3, Colombia4; República Dominicana5 Venezuela6 The soil–water balance is the primary equation used in the SWAT model, which is represented as: SW :soil content, R, Q, ET, P and QR are daily precipitation, runoff, evapotranspiration, percolation and return flow, respectly. Sed :sediment yield on a given day (metric tons) Qsurf : the surface runoff volume (mm/ha) q : the peak runoff rate (m3/s), Khru is the Universal Soil Loss Equation (USLE), CUSLE, PUSLE, LSUSLE CFRG are factors as function of soil. 1 http://swat.tamu.edu/software/swat-model/ 2(Torres B. et al., 2005; Johannes,2004), 3(Machado, 2002; Machado et al., 2003; Neves et al., 2006), 4 (Millan and Isaza, 2002); (Oñate and Aguilar, 2003)5 (Camacho et al.,2003) 6 (Silva, 2004).
The research design and methodology • Literaturereview • Training in SWAT model • Collectionofinformation
Preparation of background information of entry for the application of the hydrological model. • Analysis of the series of time. • Modeling and calibration of the Cesar River basin hydrological validation. • Write final paper
Partial results • Collectionofinformation and arrangement of data Macro
Quality of available climatic data MaxT:Maximun temperature, MaxWs:Maximun wind speed, MWs: Main wind speed, MS: Main Stream, MRH: Main relative Humidity, MT: Main temperature, mT: minimum temperature, TSB: Total solar brightness, TE: Total evaporation, TP: Total precipitation, TWt: Total wind track. Figure 1: Description of available data
Delimitation of the basin with SWAT Pte canoas Station (45 m.a.s.l)
FLOW Analysis AnnualAnalysis MonthlyAnalysis Flow duration Flood Frecuency Pte canoas Station (45 m.a.s.l)
FloodFrequencyAnalysis • Log-Pearson Type III Distribution The Log-Pearson Type III distribution is a statistical technique for fitting frequency distribution data to predict the design flood for a river at some site. Once the statistical information is calculated for the river site, a frequency distribution can be constructed. The probabilities of floods of various sizes can be extracted from the curve. The advantage of this particular technique is that extrapolation can be made of the values for events with return periods well beyond the observed flood events.
180 2
Conclusions Higher flow rates months are October and November and the lower flow are January and February. There is evidence that indicates that the discharge in the months of greater and lower discharge has been increasing in recent years.