Download
1 / 25
250 likes | 353 Views
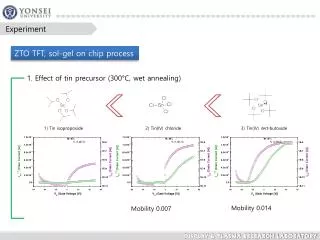
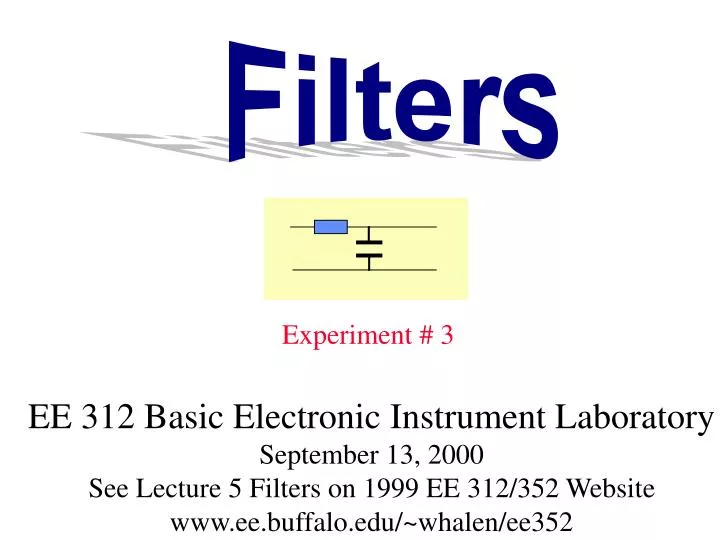
Experiment # 3. EE 312 Basic Electronic Instrument Laboratory September 13, 2000 See Lecture 5 Filters on 1999 EE 312/352 Website www.ee.buffalo.edu/~whalen/ee352. Objectives:. Design and assemble of Resistance- Capacitance (RC) and Resistance-Inductance (RL) filters.

E N D
Experiment # 3 EE 312 Basic Electronic Instrument Laboratory September 13, 2000 See Lecture 5 Filters on 1999 EE 312/352 Website www.ee.buffalo.edu/~whalen/ee352
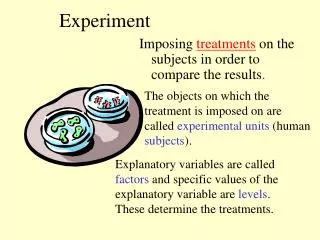
Objectives: • Design and assemble of Resistance- Capacitance (RC) and Resistance-Inductance (RL) filters. • Measure the frequency response (magnitude & phase) of RC and RL filters. • Examine the time-domain responses of these filters to a square-wave voltage .
Background: Impedance R
R Low-Pass RC Filter Low Pass RL Filter R High-Pass RL Filter High-Pass RC Filter High Low Low High
Vin(t) Vout(t) R time time 0 0 Example: Low-Pass RC Filter 0
R time 0 0 ? Phase shift Low-Pass RC Filter Vin(t) Vout(t) time ? &
Calculation for a High Pass Filter (Steady State Response) R -jXc
but fx, roughly speaking, is the frequency that separate the frequency range for which a filter passes signals from the range for which the filter attenuates signals Define crossover frequency, fx, as Then so First, look at this factor
1 Phase shift
so: or Phase Amplitude
When f >> fx, Amplitude 1, 0 Thus, this is high pass When f << fx, Amplitude 0, 90 Low frequencies are blocked
Step Response Low-Pass High-Pass Vin Vout Vin Vout Vin Vin Vout Vout Voltage on capacitor cannot change instantaneously. So Vout = Vin initially. Voltage on capacitor cannot change instantaneously. So Vout = 0 initially.
Fall Time & Time Constant Vout 100% 1.0 0.9 90% 1/e~37% 10% 0.1 time Fall Time
Relationship Between Time Constant T & Rise-Time or Fall-Time T = RC or L/R Rise-Time (Fall-Time) = T X ln9 = 2.2T
Components: • Resistor Substitution Box • Capacitor Substitution Box • 1 mH Inductor • 100 Ohms Resistor
Comment: Function Generator R oscilloscope Oscillator Filter Scope FG has 50 ohm internal resistance- keep R high enough so that crossover freq. has no more than a 10% dependence upon it. e. g. R > 500 ohm CRO has 1 Minput impedance - keep R low enough so that crossover freq has no more than a 10% dependence upon it. R < 100k Choose C so that crossover frequency fx = 1/(2RC) is well within FG frequency range. E.G. fx ~ 3 kHz.
Procedures: • 1- Determine internal impedance of the function generator which is expected to be ~50 ohms • 2- Measure low-pass RC filters characteristics • 3- Measure low-pass RL filters characteristics • 4- Simulate RC & RL low-pass filters (Bell 242) • 5-Measure time constant and fall time in a high-pass RC filter using a square wave • 6- Measure time constant and rise time in a low-pass RL filter using a square wave
1- Internal Impedance of Function Generator Rinternal RLoad Function Generator Filter impedance >> Generator impedance Rload > 10 X Rinternal
Rinternal Ix Function Generator 100 oscilloscope Step 1- Set Vp-p=10V Rinternal Function Generator oscilloscope 1M Step 2- Measure the decreased amplitude of the output signal and Ix with 100 ohms resistor Step 3- Determine Rinternal
2- Low-Pass RC Filter CRO CH1 CRO CH2 ~ R C Assemble a low-pass RC filter having a Crossover frequency of about 3 kHz
CRO CH1 CRO CH2 ~ Vout Vp-p=10V a) b) Vout Frequency . . fx . . Use Digital CRO to readout directly phase difference between input and output
L=1 mH Vout ~ R Vin 3- Low-Pass RL Filter Repeat the procedure in step 2 for an appropriate crossover frequency in the range 100 kHz to 150 kHz.
4- Simulation (PSpice) • Simulate the RC and RL low-pass filters in parts 2 and 3. Do so in Bell 242. • Perform an ac sweep between frequencies of 1Hz and 1 MHz (or from fx/100 to 100 fx) with 20 to 50 data points per decade. • Display experimental and PSPICE values for the magnitude (dB) and phase of the output voltage on the same graph.
C Vout R to oscilloscope Vin 5- Time Constant and Fall Time in a High-Pass RC Filter Measure the time constant and fall time. Use Digital CRO to readout directly fall time. Use Digital CRO Cursors to determine T = RC
6- Time Constant & Rise Time in a Low-Pass RL Filter L=1 mH Vout R Vin Measure the time constant and fall time. Use Digital CRO to readout directly fall time. Use Digital CRO Cursors to determine T = L/R